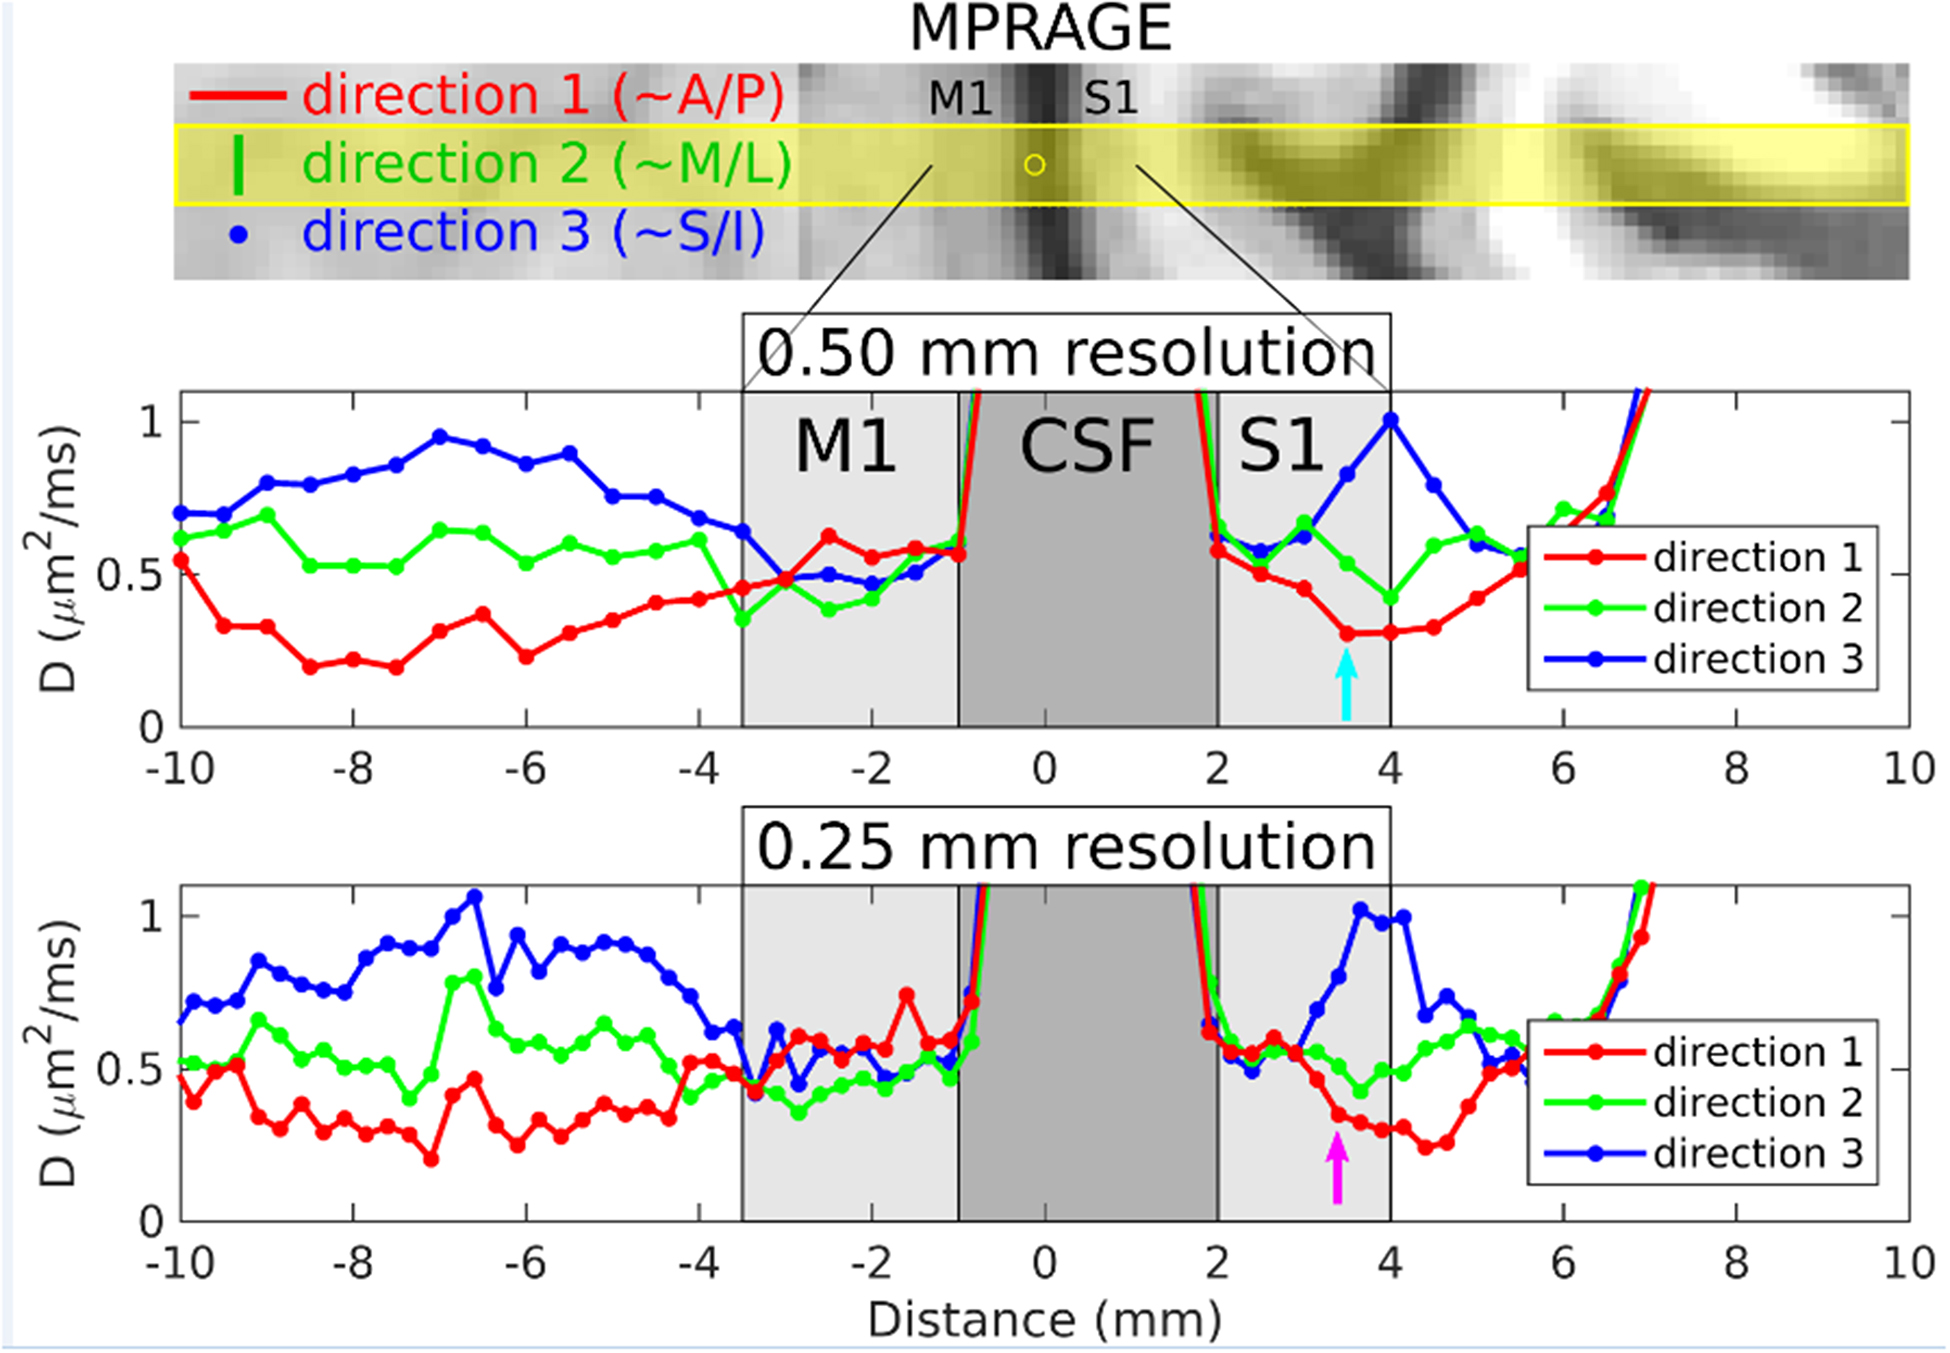
FIG. 3.

Results from volunteer 1 for the 3-dir acquisitions at 500 and 250 μm radial resolution. The top panel shows MPRAGE data resampled into the same orientation as the line-scan acquisitions. The prescribed line location and thickness are overlaid in yellow, with the yellow circle indicating the center point of the line (i.e., the origin in the plots below). For the three directions indicated (direction 1: ~A/P=anterior/posterior and radial to M1/S1 at this location, direction 2: ~M/L=medial/lateral and tangential to M1/S1 at this location, direction 3: ~S/I=superior/inferior and also tangential to M1/S1 at this location), plots of apparent diffusion coefficient D versus position along the line are shown in the middle and bottom panels for the 500 and 250 μm radial resolution acquisitions, respectively. M1 and S1 (light gray shaded regions) and central sulcus CSF (dark gray shaded region) were delineated based on the MPRAGE image in the top panel.
