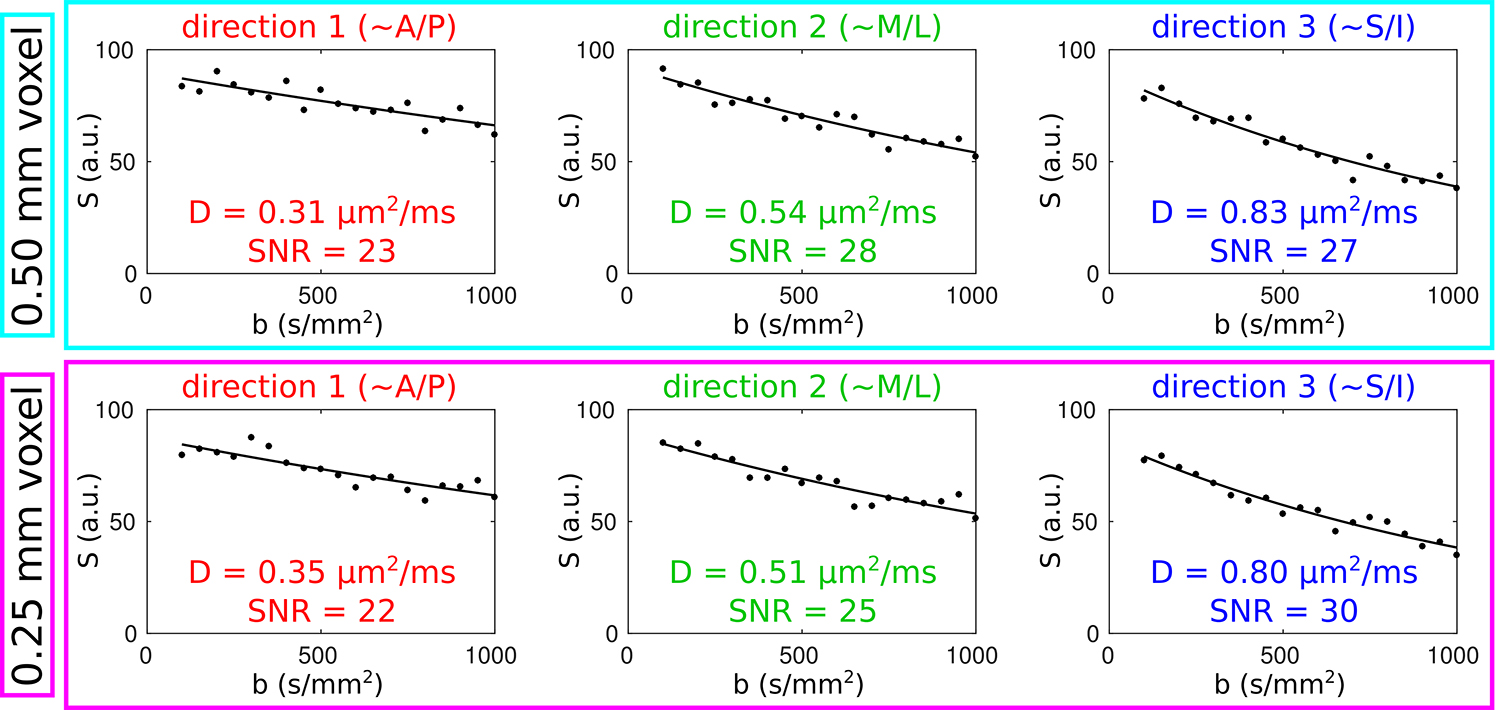
FIG. 4.

For the 500 μm voxel (in deep S1) indicated by the cyan arrow in Figure 3, the upper panel shows plots of signal magnitude versus b-value for each of the directions in the 3-dir acquisitions (dots=data points, curves=monoexponential fits) and the lower panel shows the corresponding plots for the 250 μm voxel indicated by the purple arrow in Figure 3. Along with the apparent diffusion coefficients D derived from the fits, SNR estimates are also shown; these were calculated by dividing the y-intercept of the fitted curves by the standard deviation of the residuals.
