
FIG. 5.
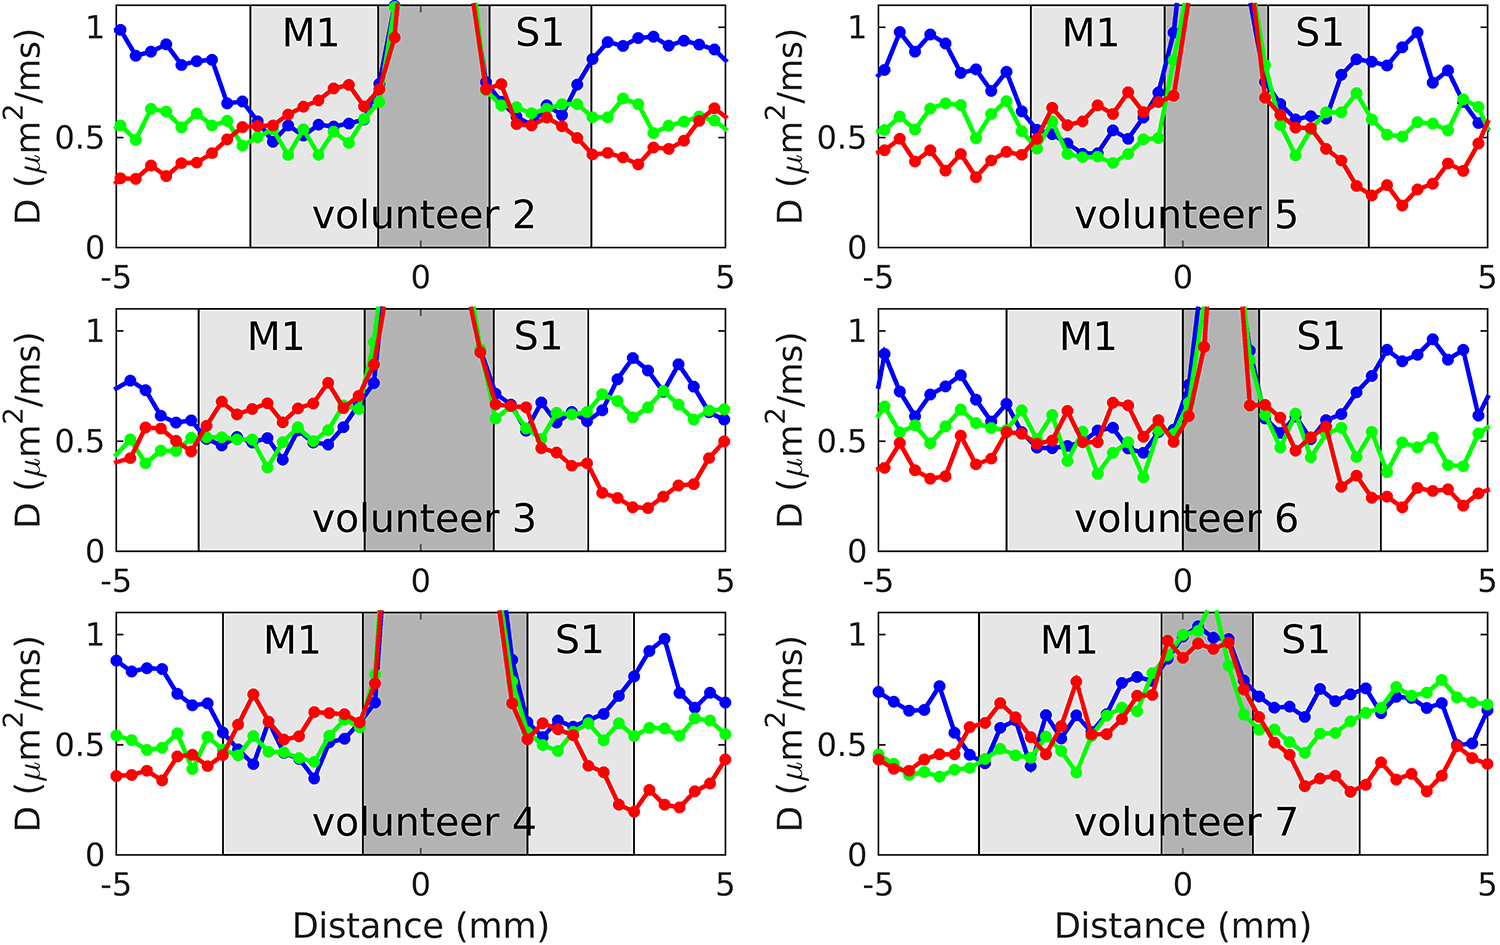
Plots of ADC versus location for volunteers 2–7, for the 3-dir acquisitions at 250 μm radial resolution. As in Figure 3, the red curves correspond to the diffusion gradient direction being in the radial direction, along the line and in roughly the A/P direction, whereas the green and blue curves correspond to two orthogonal diffusion gradient directions, tangent to cortex, in roughly the M/L and S/I directions, respectively.