Figure 6.

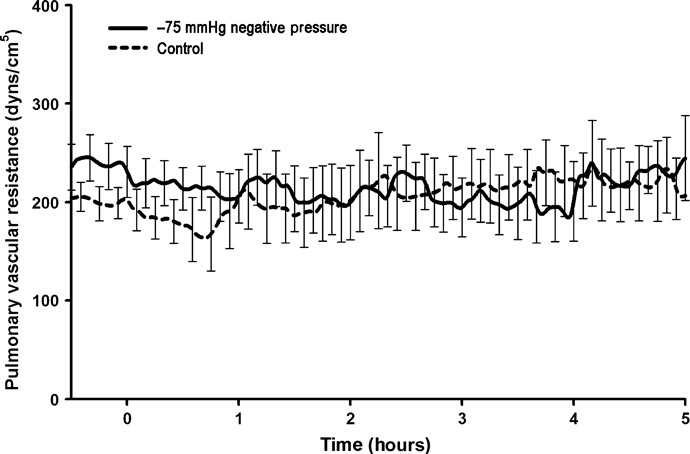
Pulmonary vascular resistance (PVR) (dyn s/cm5) during negative pressure application at −75 mmHg over a 5‐hour period. No significant change in PVR was found compared with the control group.

Pulmonary vascular resistance (PVR) (dyn s/cm5) during negative pressure application at −75 mmHg over a 5‐hour period. No significant change in PVR was found compared with the control group.