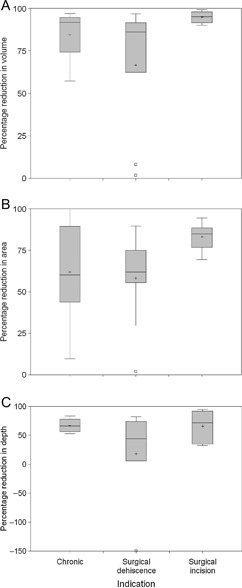
Figure 1.

Percentage reduction in wound dimensions divide by indication. The percentage reduction in volume (A), area (B) and depth (C) were calculated and box plots generated. Within each box, the horizontal line is the median and the cross indicates the mean. The box indicates the interquartile range, and the cut‐off lines above and below extend 1·5 times the interquartile range from the 25th or 75th percentile rolled back to where there are data. Those patients who lie outside this distance are represented by a square (outliers).
