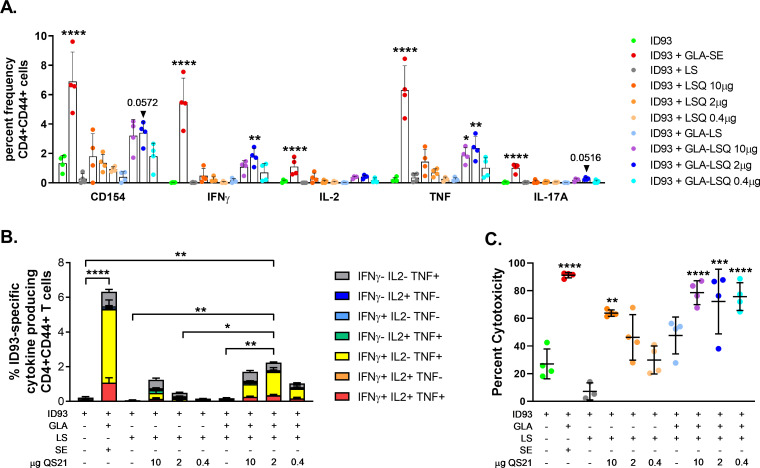
Fig 4. Immunogenicity of C57BL/6 mice four weeks after the final immunization with ID93+GLA-LSQ.
Mice were immunized with ID93 combined with GLA-LS containing different QS-21 doses (10, 2 or 0.4 μg). (A) The percent frequency of single-cytokine producing ID93-specific CD4+ T cells. Bars represent the mean of the group, with vertical lines indicating SD. Groups were compared for each cytokine using one-way ANOVA with Bonferroni’s multiple comparison test, with *p<0.05, **p<0.01, ****p<0.0001 versus ID93 alone, an exact p value is shown for values near significance; (B) percent of polyfunctional ID93-specific CD4+CD44+CD154+ T cells producing one or more cytokines. The data are represented as the percentage of CD4+CD44+CD154+ T cells producing one or more cytokines following ex-vivo stimulation with ID93; cytokine producing subsets are shown as stacked bars, with mean + SD of each subset. Comparisons of total cytokine producing cells between groups were performed using one-way ANOVA with Bonferroni’s multiple comparison test, *p<0.05, **p<0.01, ****p<0.0001; (C) percent CD4+ T cell cytotoxicity. Mean and SD, with individual mice, are shown. Comparisons between the groups were performed using one-way ANOVA with Bonferroni’s multiple comparison test; **p<0.01, ***p<0.001, ****p<0.0001 versus ID93 alone.

