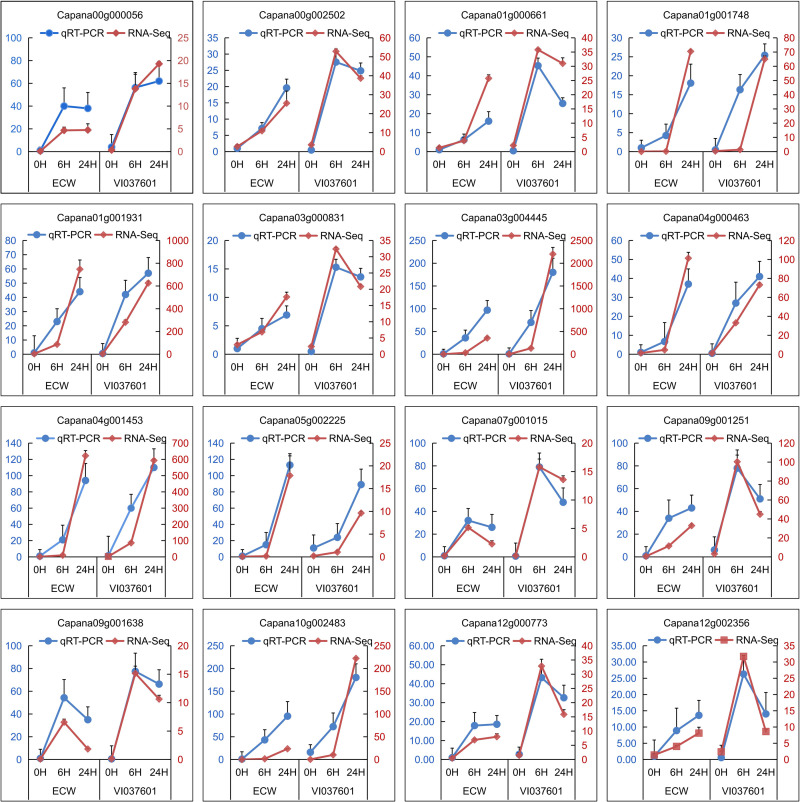
Fig 7. qRT-PCR based validation of DEGs in response to Xcv inoculation at different time intervals.
Right ordinate (in red) represents the FPKM value of RNA-Seq. Left ordinate (in blue) represents the relative expression level of qRT-PCR. The expression level of genes in ECW at 0 hpi was set as 1.0, and other samples were calculated accordingly. The abscissa represents 0 hour, 6 hours and 24 hours (from left to right) post Xcv inoculation in ECW and VI037601. Data were represented as mean ± SD for three biological replicates.

