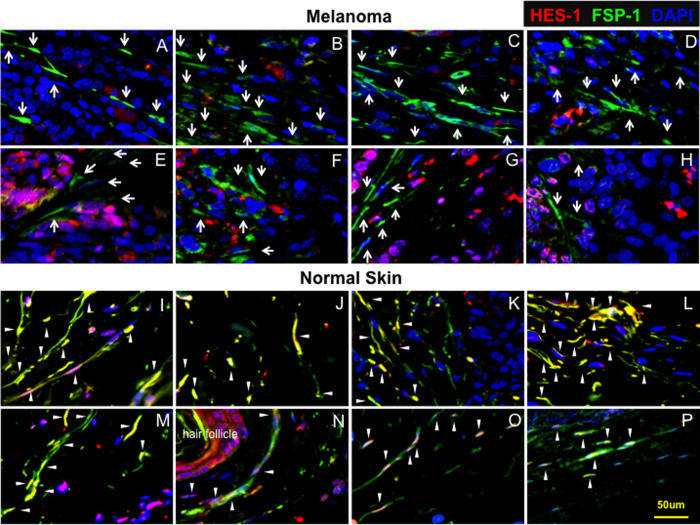
Fig 1. Low Notch activity in MAFs.
Sixteen representative IF images of tissue microarrays show that MAFs express lower levels of Hes-1 compared to normal skin fibroblasts. White arrows point to MAFs (top), while white arrowheads indicate Hes-1 expression in fibroblasts in normal skin tissues (bottom). The strong Hes-1 expression detected in melanoma tissues (top) is from malignant melanoma cells in which the Notch pathway is activated, not from MAFs, which are stained as green cells. In normal skin (bottom), nuclear Hes-1 is pink as overlapping of blue (DAPI for nuclei) and red (Hes-1), and cytoplasmic is red, because of strong expression of Hes-1 (red). Top: A, B, D, E, F, G are melanomas at stage II; C at stage I, and H at stage III. The Notch pathway is activated in melanomas D−H, and is inactivated in melanomas A−C (a few cells stained red in A−C are infiltrated immune cells based on their morphology). Bottom: I−M are adjacent skin tissues, while N−P are non-adjacent skin tissues. A single scale bar in a panel of pictures is representative for all pictures.

