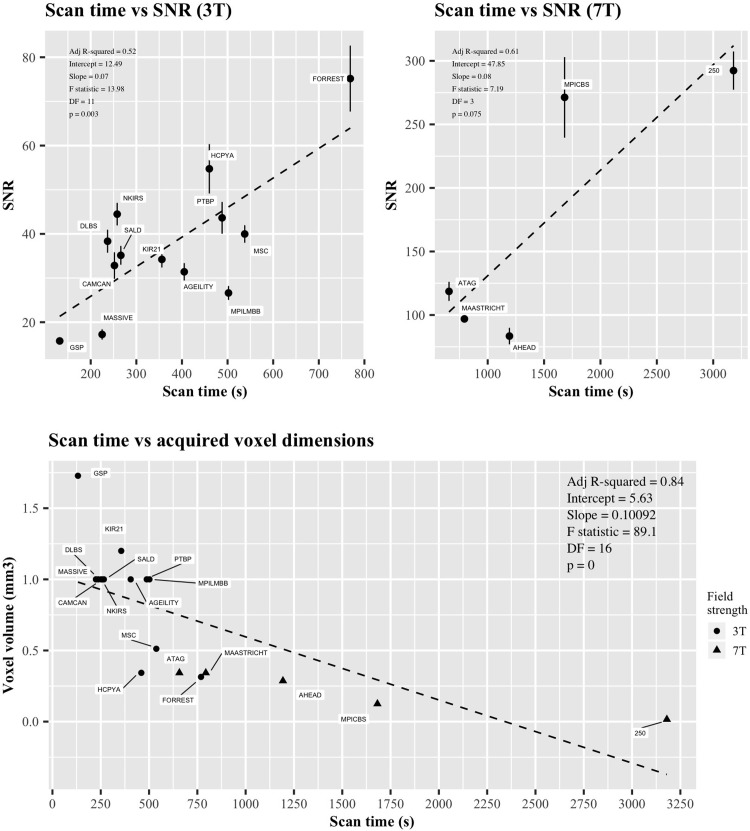
Fig 8. The relationship between the SNRCC and voxel dimensions of T1w images with scanning time in 18 databases.
A) Graphical representation of SNRCC and scan time. Error bars indicate standard error of the mean. B) Graphical representation of voxel dimensions and scan time. Both legends contain information relating to the adjusted R-squared value, intercept, slope, F statistic, degrees of freedom and p-value. Circular symbols indicate 3T data, triangular symbols indicate 7T data.

