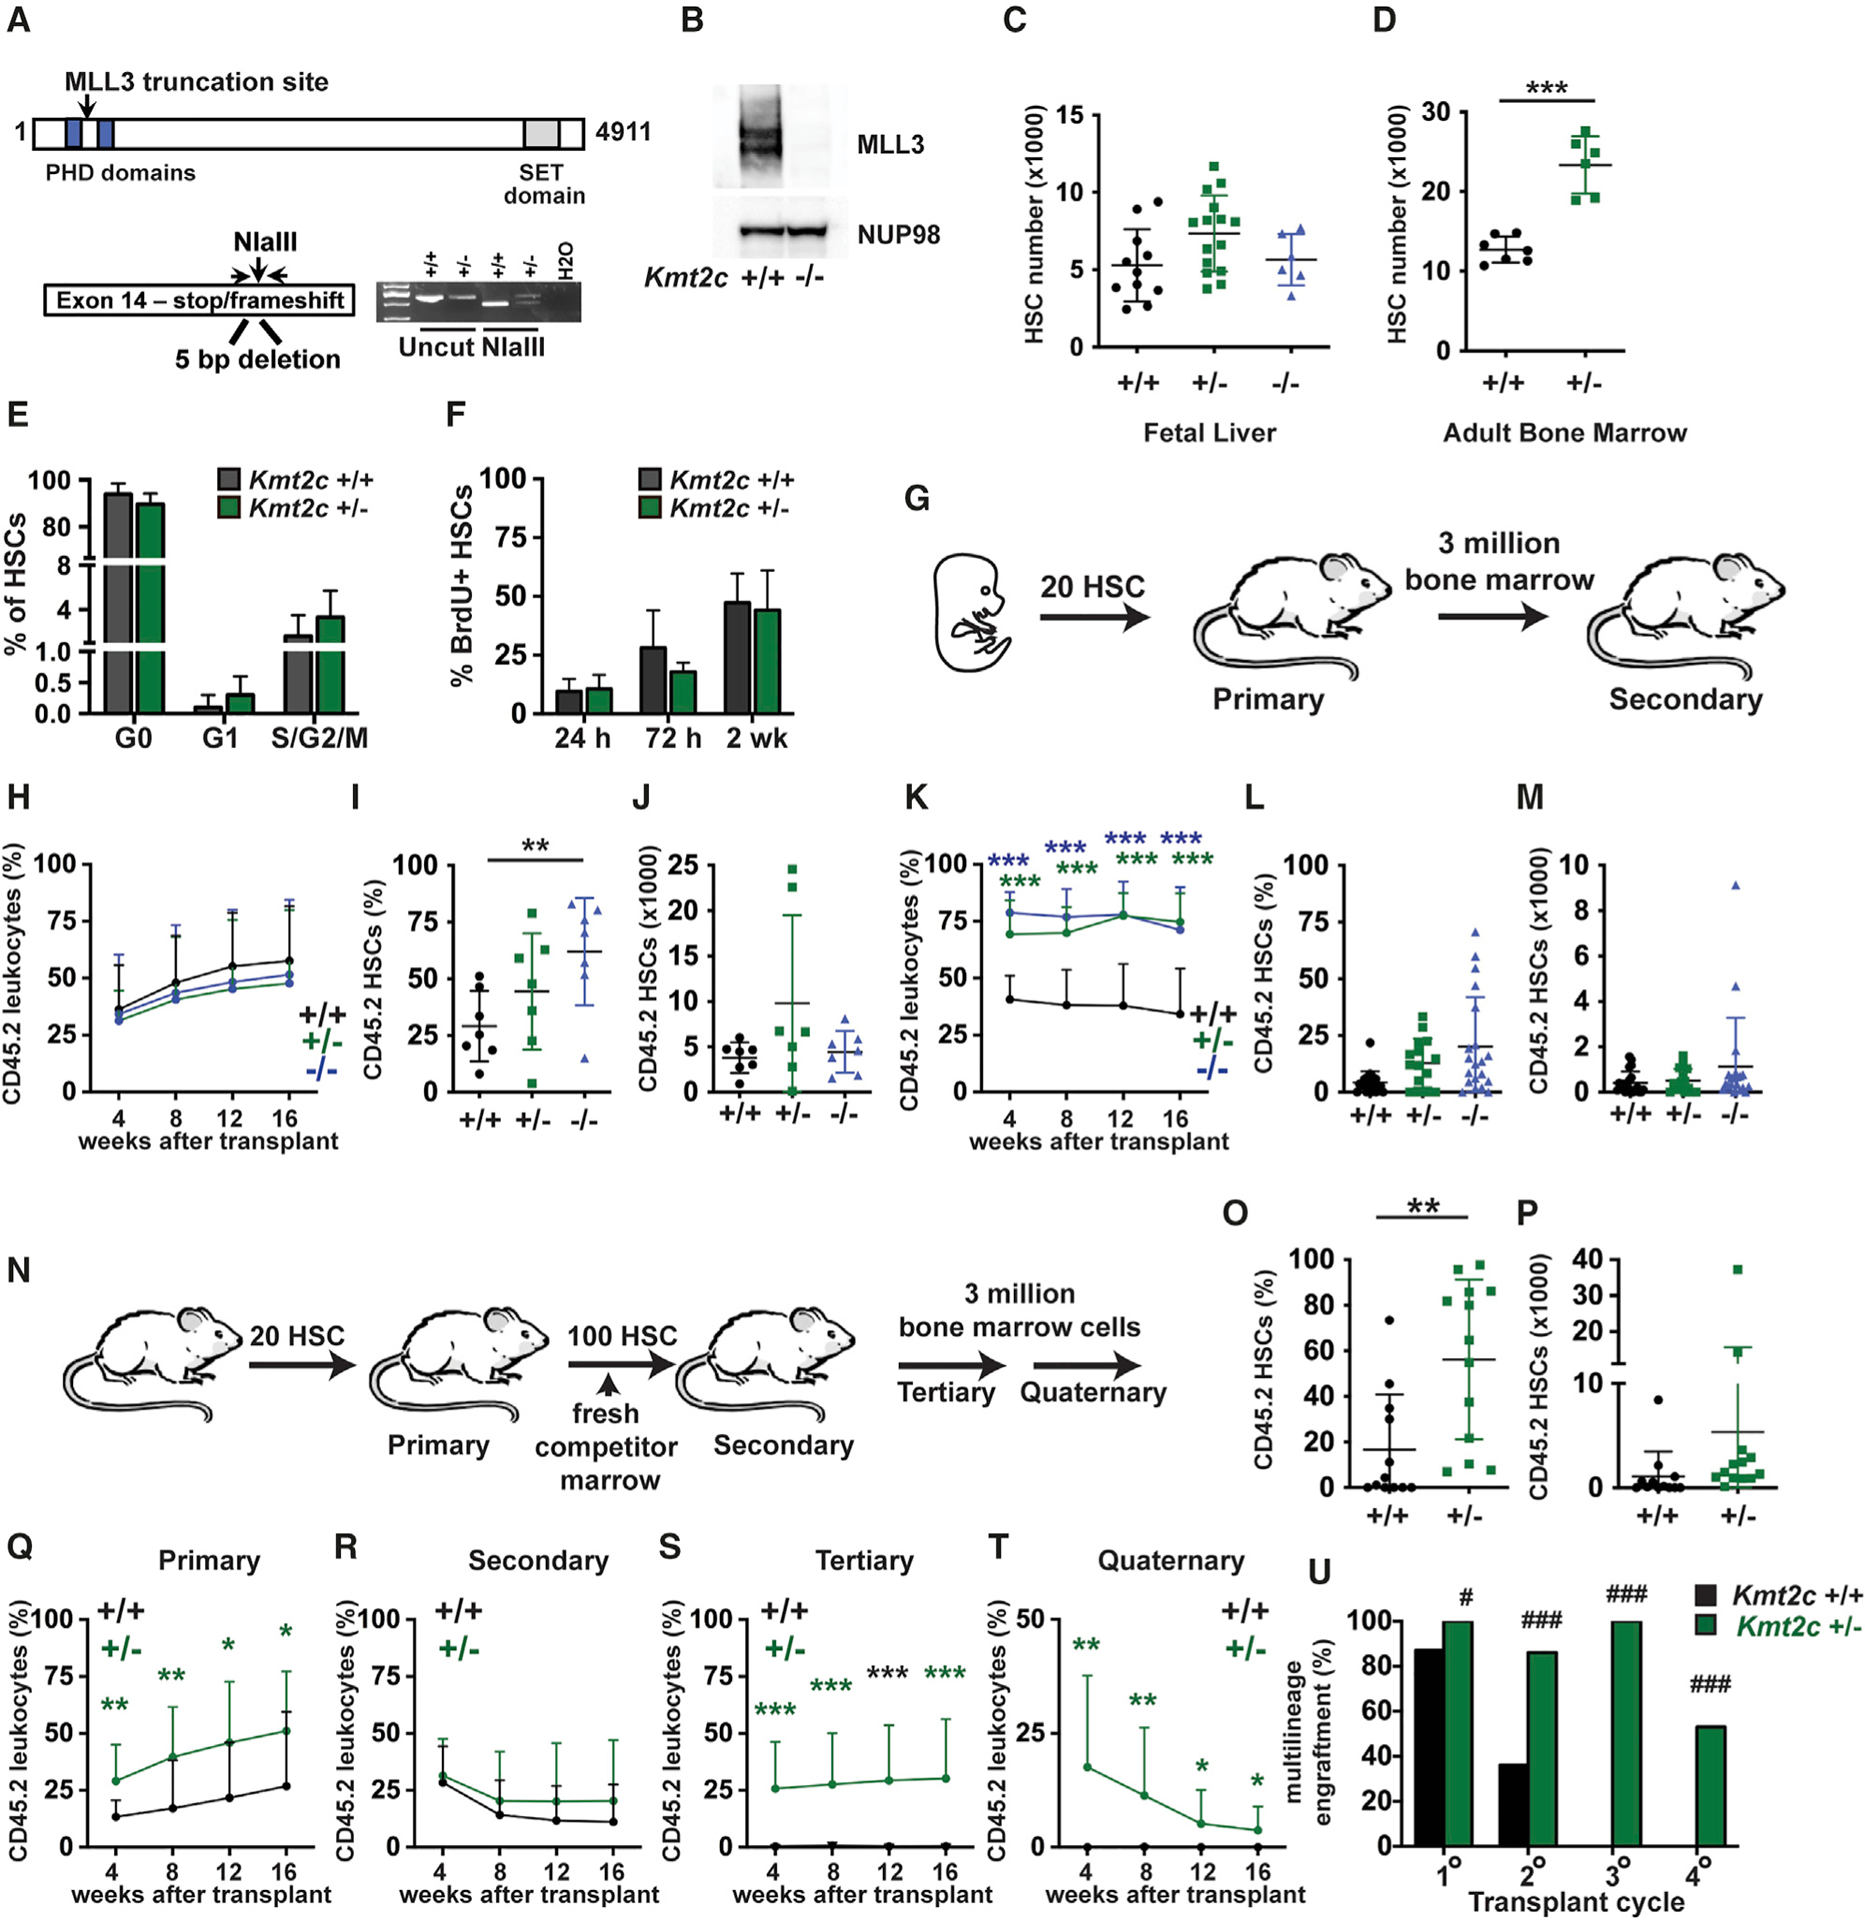
Figure 1. Haploid Kmt2c deletion increases HSC numbers and enhances HSC self-renewal capacity.

(A) Overview of the germline Kmt2c null allele.
(B) MLL3 expression in lysates from wild-type and Kmt2c−/− MEFs, as assessed by western blot.
(C and D) HSC numbers in E18.5 fetal livers or 8-week-old adult bone marrow (two hindlimbs) from mice of the indicated Kmt2c genotypes. n = 6–15 (fetal) or 6–7 (adult).
(E) Cell-cycle phase distributions of adult Kmt2c+/+ and Kmt2c+/− HSCs as determined by Ki67/DAPI staining. n = 5–6.
(F) HSC BrdU incorporation after 24 h, 72 h, or 2 weeks of BrdU exposure. n = 3–7 per time point and genotype.
(G) Competitive transplantation of fetal HSCs overview.
(H) CD45.2+ donor leukocyte chimerism in peripheral blood from primary recipients at the indicated weeks after transplant. n = 14–15 recipients per genotype from at least three independent donors.
(I and J) Donor HSC chimerism and numbers in primary recipient bone marrow 16 weeks after transplantation. n = 7.
(K) Donor leukocyte chimerism in secondary recipients after transplantation of 3 million primary recipient bone marrow cells. n = 15–20 recipients per genotype from at least 5 independent donors.
(L and M) Donor HSC chimerism and numbers in secondary recipient bone marrow 16 weeks after transplantation. n = 15–20.
(N) Serial transplantation of adult HSCs overview.
(O and P) Donor HSC chimerism and numbers in primary recipient bone marrow. n = 12–13.
(Q–T) CD45.2+ donor leukocyte chimerism in peripheral blood from primary, secondary, tertiary, and quaternary recipient mice at the indicated weeks after transplant. n = 14–15 recipients per genotype and transplant cycle from at least three independent donors.
(U) Percentage of mice with multi-lineage CD45.2 chimerism (myeloid, B, and T cell) at 16 weeks after each of the indicated transplant cycles.
For all panels, error bars reflect standard deviation. *p < 0.05, **p < 0.01, ***p < 0.001; comparisons were made by two-tailed Student’s t test or one-way ANOVA with Holm-Sidak post hoc test (multiple comparisons). (U) #p < 0.05, ###p < 0.001, by Fisher’s exact test. See also Figures S1 and S2.
