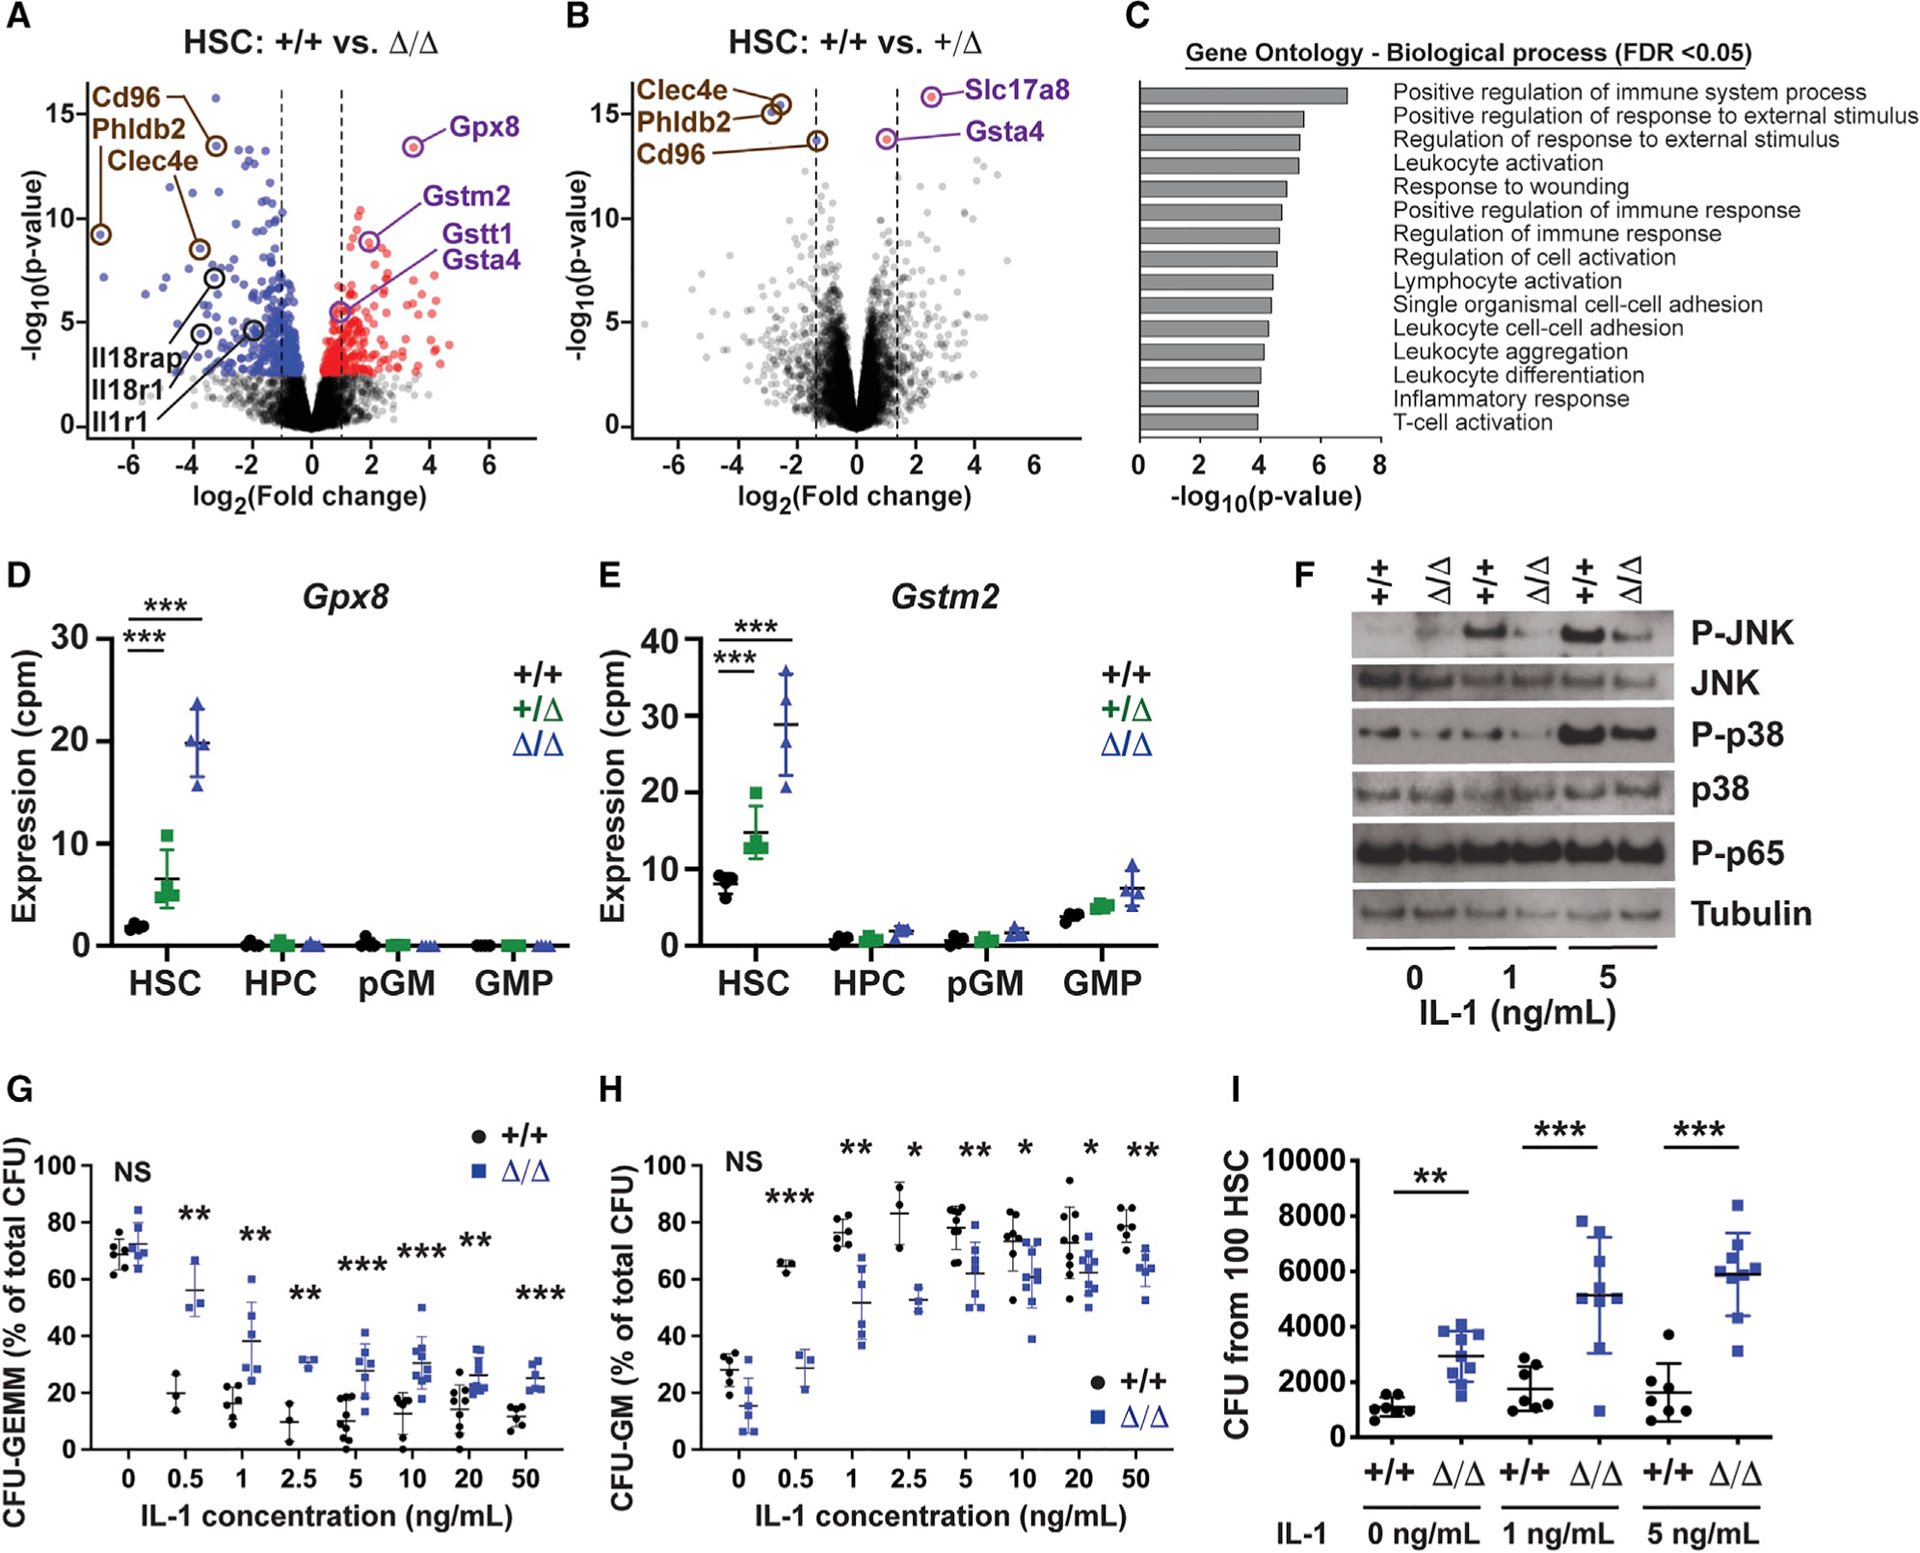
Figure 4. Kmt2c deletion reduces sensitivity to IL-1 and enhances antioxidant gene expression in HSCs.

(A and B) Volcano plots showing gene expression changes in Kmt2cΔ/Δ and Kmt2cΔ/+ HSCs. Red and blue denote significantly increased or decreased expression after Kmt2c deletion (FDR < 0.05). n = 4.
(C) GAGE pathway analysis of genes reduced in Kmt2cΔ/Δ HSCs.
(D and E) Gpx8 and Gstm2 expression in HSCs, HPC-1 s, pGMs, and GMPs. n = 4 per genotype.
(F) Western blots showing JNK, p38, and p65 phosphorylation in HSCs after ex vivo IL-1β exposure.
(G and H) CFU-GEMM and CFU-GM percentages for wild-type and Kmt2cΔ/Δ HSCs plated in the indicated IL-1β concentrations. n = 3–8.
(I) Total CFU activity after 100 wild-type and Kmt2cΔ/Δ HSCs were cultured for 7 days with IL-1β at the indicated concentration. n = 7–9. Error bars reflect standard deviation.
*p < 0.05, **p < 0.01, ***p < 0.001; comparisons were made by two-tailed Student’s t test or one-way ANOVA with Holm-Sidak post hoc test (multiple comparisons). See also Figures S4 and S5 and Table S1.
