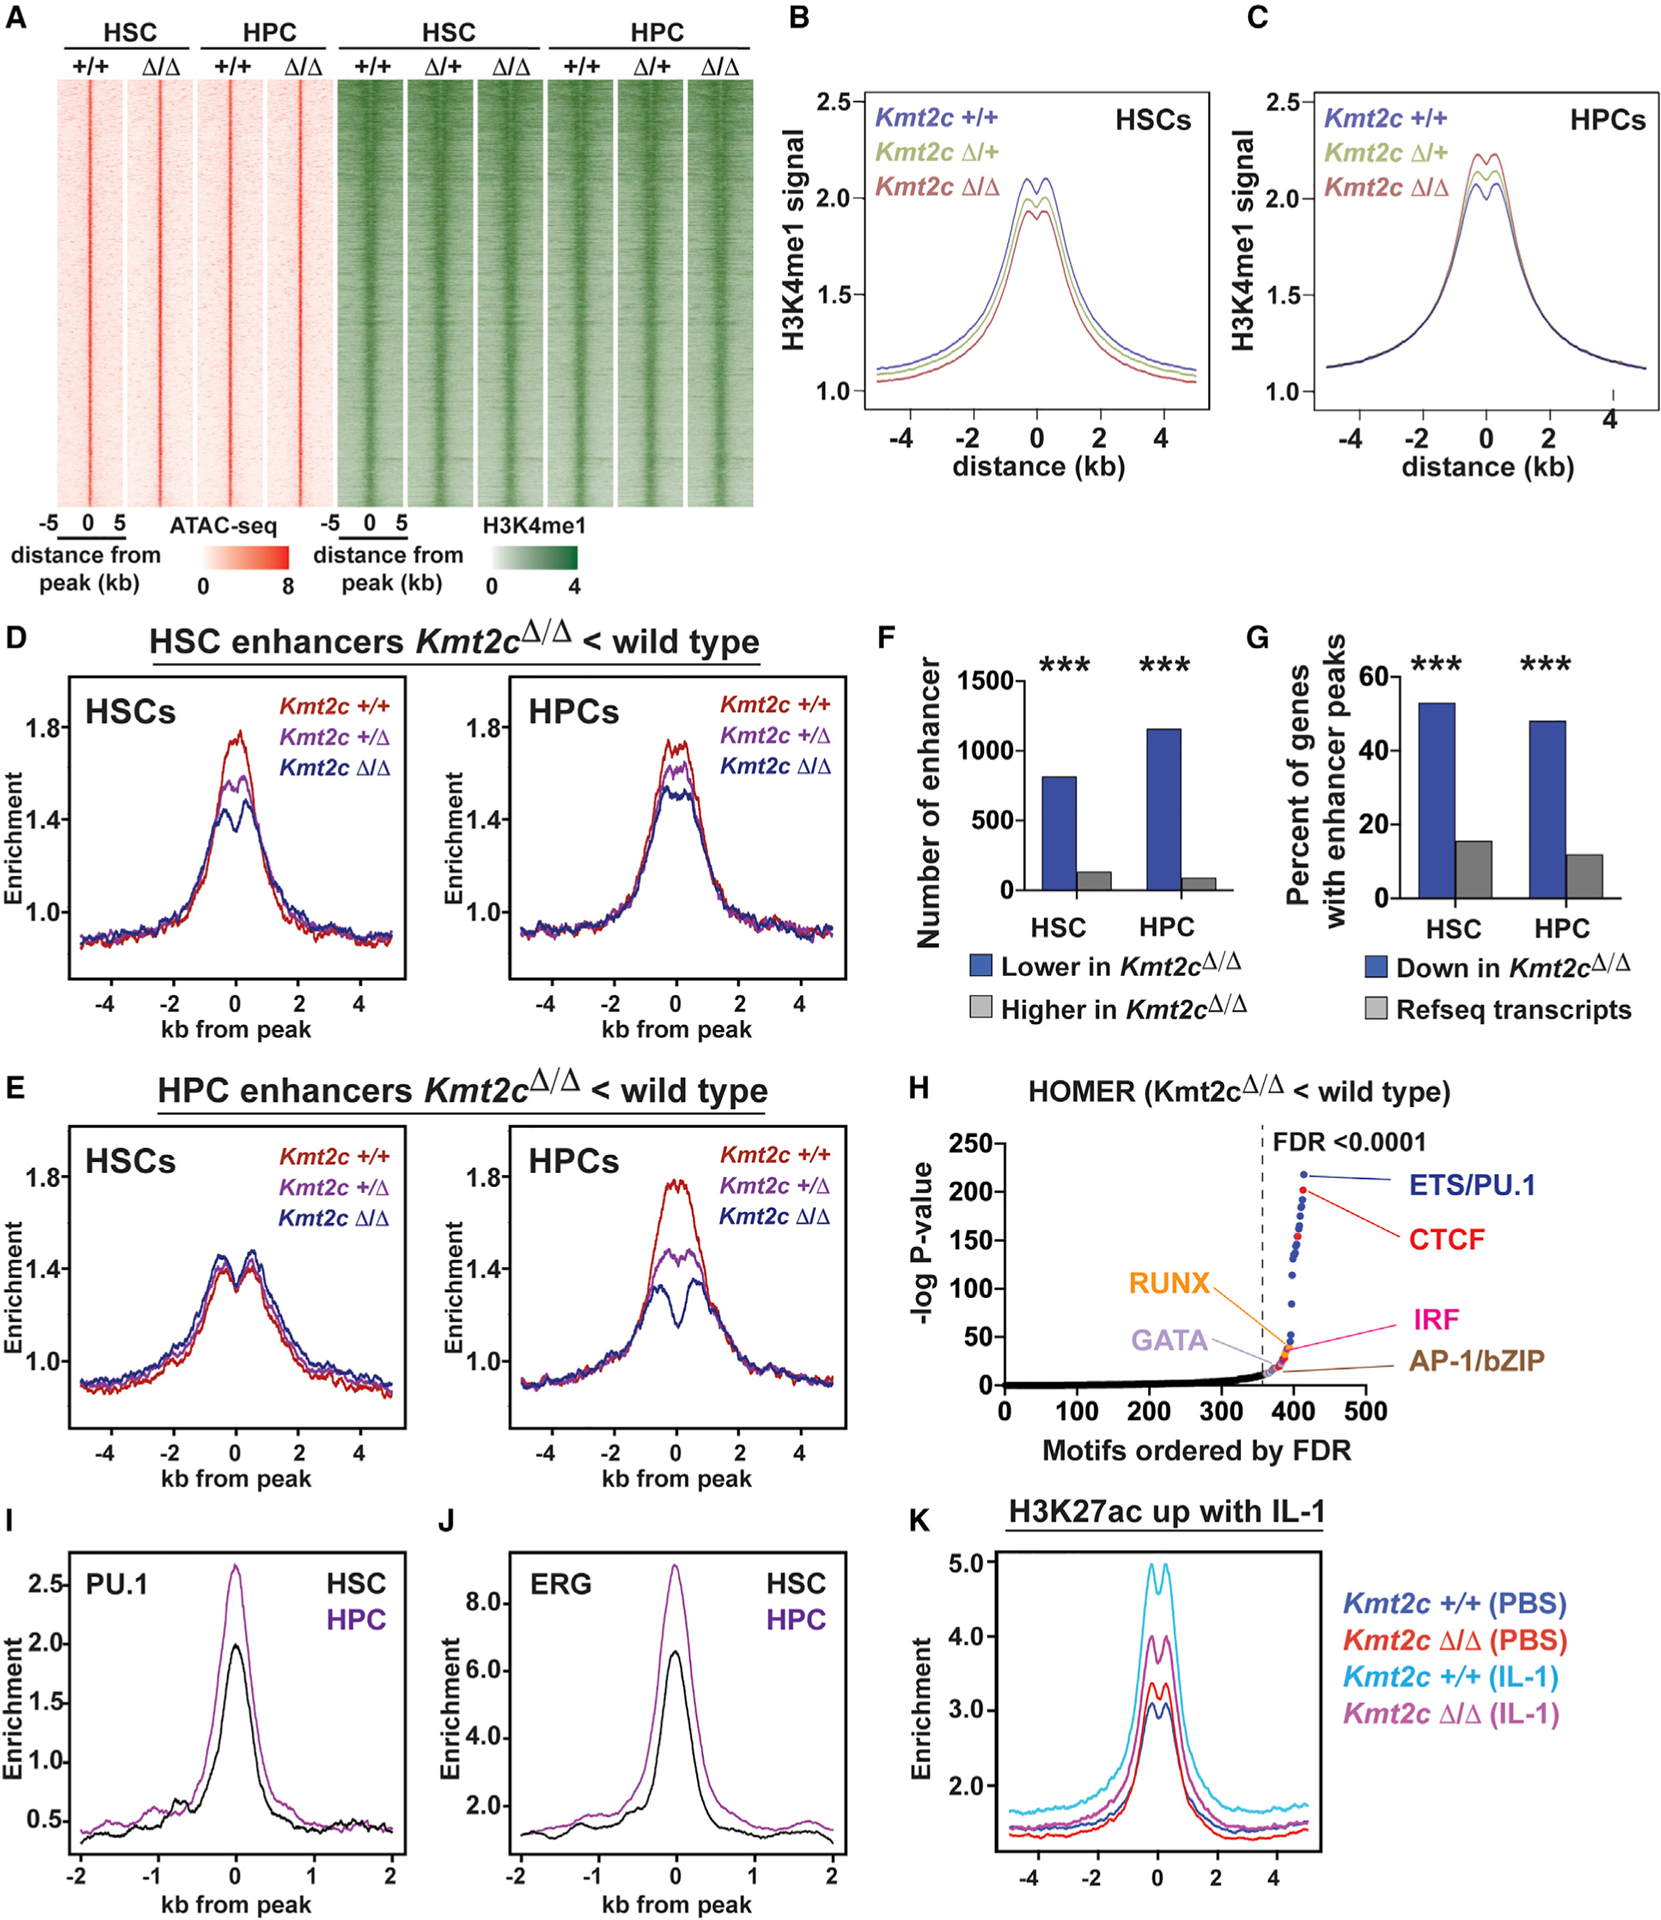
Figure 6. MLL3 promotes enhancer priming and IL-1 target enhancer activation during HSC to HPC differentiation.

(A) ATAC-seq (red) and H3K4me1 (green) peaks for all identified HSC and HPC enhancers.
(B and C) Aggregate H3K4me1 levels in wild-type, Kmt2cΔ/+, and Kmt2cΔ/Δ HSCs and HPCs, all enhancers.
(D) Histograms showing H3K4me1 at enhancers with reduced H3K4me1 in Kmt2cΔ/Δ HSCs relative to wild-type HSCs (HSC enhancers). Data are shown separately for HSCs and HPCs.
(E) Histograms showing H3K4me1 at enhancers with reduced H3K4me1 in Kmt2cΔ/Δ HPCs relative to wild-type HPCs (HPC enhancers). No Kmt2c-dependent changes are observed for these enhancers in HSCs.
(F) Numbers of enhancers with increased or decreased H3K4me1 levels after Kmt2c deletion.
(G) Percent of Kmt2c-regulated genes (from Figure 4) with enhancers located within 100 kb of the transcriptional start site. All RefSeq genes are shown as a control. ***p < 0.0001 by hypergeometric test.
(H) HOMER motif enrichment showing −log p values for each motif ranked according to decreasing false discovery rate (FDR). Motifs with FDR < 0.0001 are color coded based on unique classes of transcription factor binding domains.
(I and J) PU.1 and ERG binding at HSC and HPC enhancers in HPC-7 cells.
(K) H3K27ac at IL-1 target enhancers in wild-type and Kmt2cΔ/Δ HPCs.
See also Figure S6.
