
FIG. 8.
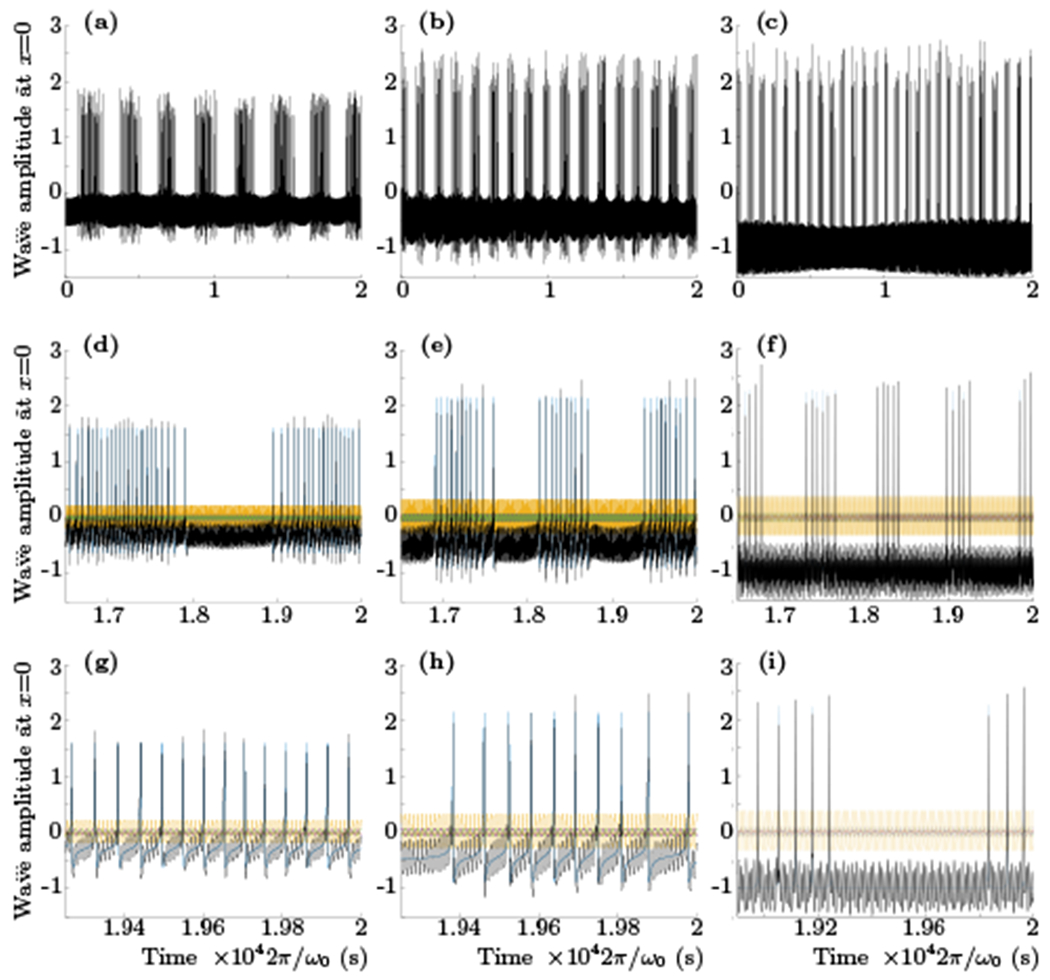
The results of numerical integration of the system (35). For all plots the values of ωk0, k0, α and β were set to be equal to 1 and the resonant coupling λ was 0.05. Different values of δ were again used in real and imaginary parts (as in (31) and (32)) with δA = 3π/4, 0, 0, δB = 3π/4, 3π/4, π/2 and close to the critical values of γ = 1.731, 2.575, 2, 9969 for the left, middle and right columns respectively. The total potential ϕ is plotted with the black and different colors show the oscillations of the individual modes. All plots show that when γ is sufficiently close to criticality a week coupling produces jumps from subcritical to supercritical regimes with amazingly regular low–frequency quasiperiodicity (time and amplitude units are arbitrary).