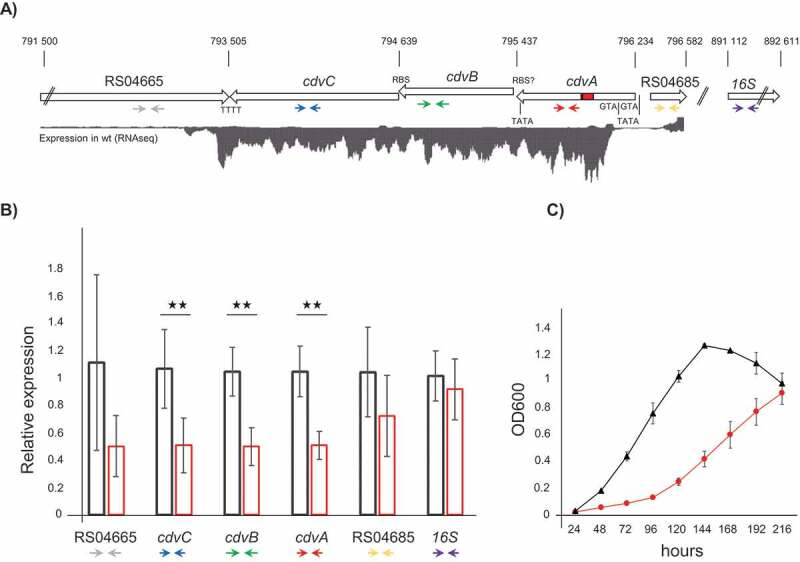
Figure 2.

Silencing of the cdvABC locus. A) Schematic representation of the S. solfataricus P1 chromosomal regions 791 500–796 582, and 891,112–892,611, containing the genes SSOP1_RS04665, cdvC (SSOP1_RS04670), cdvB (SSOP1_RS04675) cdvA (SSOP1_RS04680), SSOP1_RS04685 and the 16S rRNA gene (SSOP1_RS05165), respectively. Red rectangle in cdvA = protospacer targeted by miniCR-CA-2; TATA boxes, RBS and ATG are indicated to scale. Expression levels of the first chromosomal region are represented by a read coverage histogram obtained from wild type S. solfataricus P1 RNA-Seq data. Coloured arrows below genes represent binding sites of primers used in RT-qPCR (see B). B) Relative expression of each gene (using primer pairs indicated above) relative to the gapN-3 mRNA measured by RT-qPCR on reverse transcribed RNA extracts of control (black left bar) and cdvA-targeted cultures (red right bar), harvested at OD600 = 0.2 each. Error bars, mean ± SD (n ≥ 3); Significant differences to Ctrl are indicated by asterisks (two-tailed t test, n ≥ 3, p ≤ 0.009). C) Growth profiles (OD600) of control (black triangle) and cdvABC – silenced cultures (red circles). Error bars, mean ± SD (n = 3)
