
Figure 3.
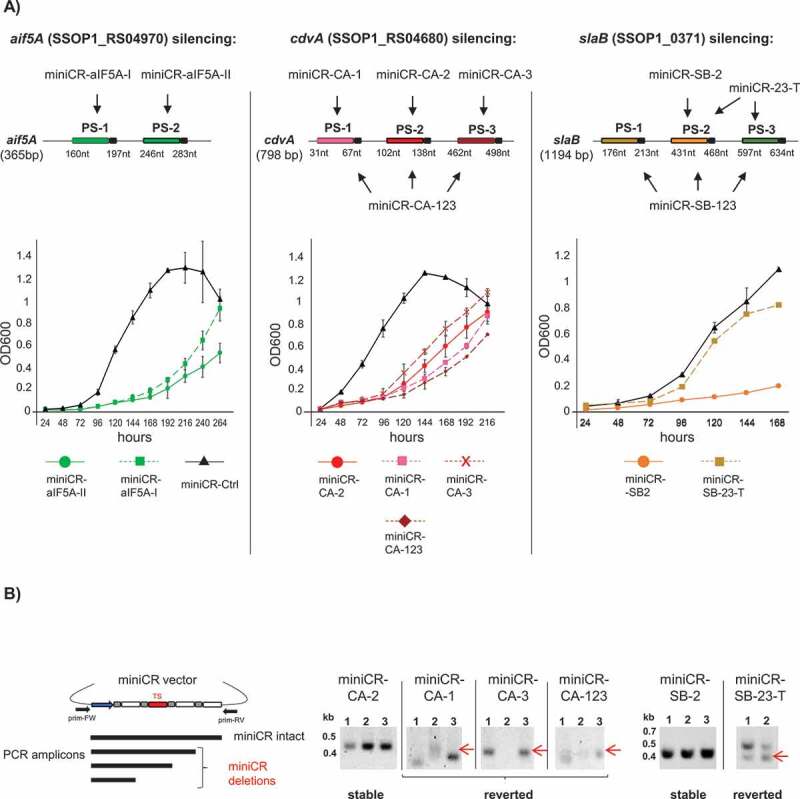
Stably silenced and reverting cultures in aif5A, cdvA and slaB silencing experiments. A) Upper panel: Schematic representation of mRNAs of each gene and corresponding silencing miniCR constructs where arrows point to protospacers regions targeted by each construct (cf. Table 1). The positions of protospacers (PS) including PAS (coloured boxes with black tail) on respective mRNAs are given with respect to the gene length. Lower panel: Growth profiles (OD600) of cells transformed with miniCR constructs leading to stably silenced cultures (coloured continuous lines)* and strong miniCR construct leading to reverted cultures (coloured discontinuous lines). Black lines (triangle) represent control cultures transformed with miniCR-Ctrl, devoid of a targeting spacer. Error bars, mean ± SD (n = 3). MiniCR-SB-23-T: culture transformed with miniCR-23 and transferred to fresh medium once. *Growth profiles of miniCR-SB-2/miniCR-aIF5A-II of another sample set have been published [31,32], but fresh transformants grown in parallel with the depicted revertant cultures are presented here. B) Left panel: Schematic representation of PCR products generated by culture PCR on stably silenced/reverted cultures using primers (prim-FW, prim-RV) binding up and downstream of the miniCR cassette, respectively. Amplicons of different lengths reflect the integrity of the miniCR array. Right panel: Agarose gels depicting culture PCR amplicons of miniCR cassettes in respective transformants (same cultures as in A sampled at OD600 = 0.2 were used as templates). Band heights emerging from deletions in miniCR arrays are indicated by red arrows and often appear as multiple or fuzzy bands in reverted cultures. Position of DNA ladder is indicated (kb). Representative agarose gels of culture PCRs on miniCR-SB-123 and miniCR-aIF5A-I carrying revertant cultures can be found in refs. [31] and [32], respectively