
Figure 4.
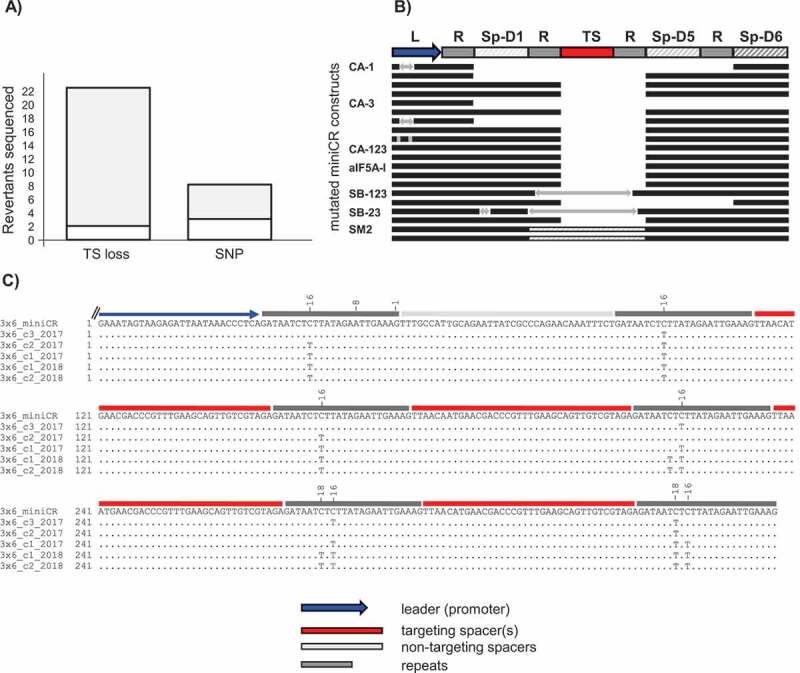
Analysis of mutations of sequenced miniCR array in reverted cultures. A) Stacked bar plot representing the absolute number of sequenced miniCR recovered from reverted cultures exhibiting deletions (TS loss) or single nucleotide polymorphisms (SNP) of/in the targeting spacer, respectively. Grey area in TS loss = spacer losses at repeat junctions, white area in TS loss = imprecise spacer deletions; Grey area in SNP = SNPs in repeat regions -16/-18 (cf. C), white area in SNP = SNPs found elsewhere (cf. Table S1). B) Schematic alignment of miniCR arrays exhibiting spacer losses at repeat junctions. An intact miniCR is schematically represented as reference; arrows represent insertions; dashed lines in SM2 represent a doubling event of Sp-D5. C) Sequences of miniCR-SB3x6 retrieved from five colonies of individual transformants aligned to the intact miniCR-SB3x6 array (3x6_miniCR); four spacer shown, as only these regions were affected