
Figure 3.
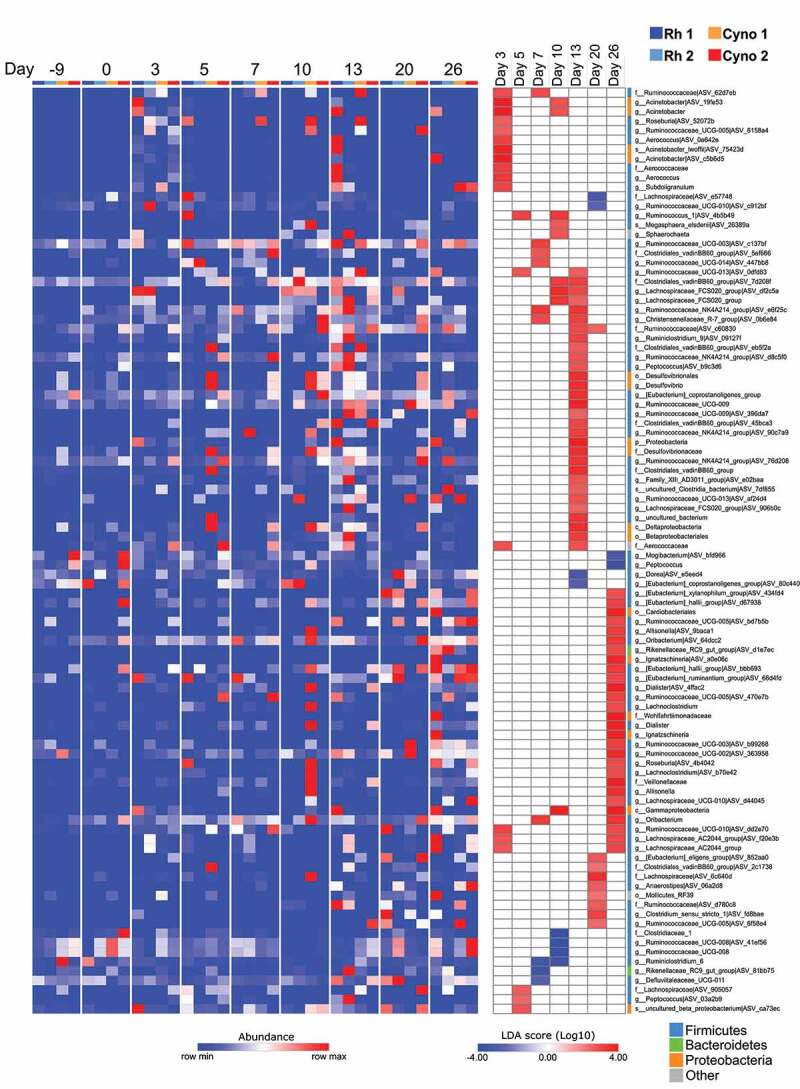
Alterations in the fecal microbiota’s composition over the course of a SARS-CoV-2 infection. A linear discriminant analysis effect size (LEfSe) analysis shows that the representation of the various bacterial taxa changed over the course of the infection. Only taxa with a statistically significant LDA score (log10) > 2 (compared with day −9 & 0) are shown. The heat map on the left shows the relative abundance of the taxa, and the heat map on the right shows the LDA scores. The taxa are clustered by abundance pattern by day compared to D-9 and D0