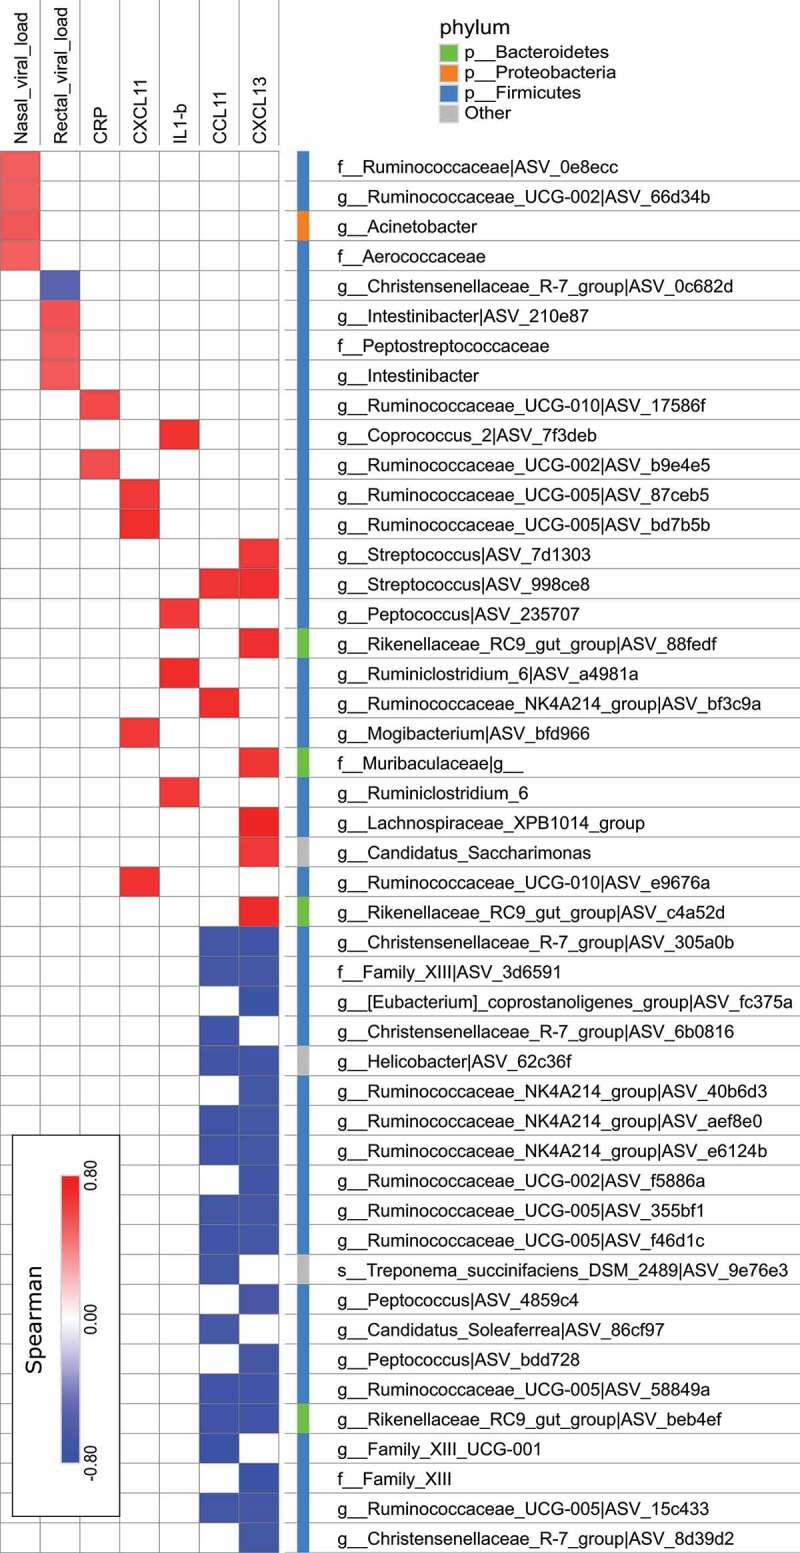
Figure 5.

Correlations between bacterial taxa and infection-related variables. Correlation networks were built using Spearman’s correlation and figures were built using Cytoscape V.3.8.0. Only significant correlations (p < .05 and q < 0.15 after correction for the false discovery rate, using the Benjamini-Hochberg procedure) are shown
