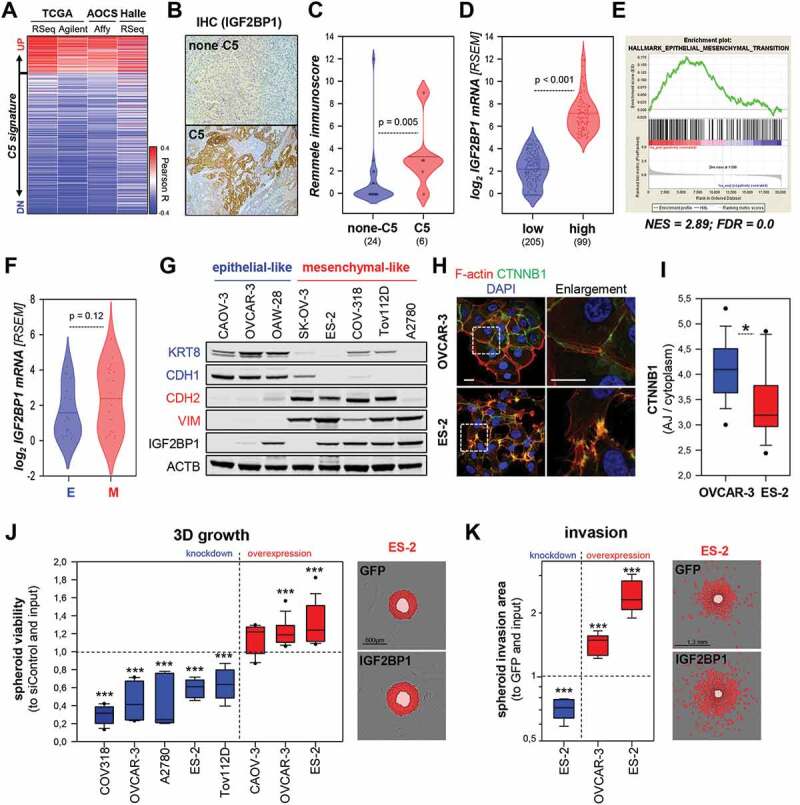
Figure 1.

IGF2BP1 is associated to the C5 signature and promotes mesenchymal properties. (A) IGF2BP1 expression was correlated to the C5 signature using indicated data sets. Pearson correlation coefficients (R) are shown as heat map. (B, C) IHC staining of EOC samples classified as C5 or none-C5 via NGS based GSEA analyses using IGF2BP1-directed antibodies (B). IGF2BP1 staining was quantified using the Remmele immune score in none-C5 (24) and C5 (6) samples (C). (D) IGF2BP1 mRNA expression is shown by violin plots, in the TCGA-OV-RNA-Seq cohort distinguished in IGF2BP1-high (log2 RSEM ≥ 5) or -low (log2 RSEM ≤ 5). (E) GSEA plot of the HALLMARK_EMT gene set based on gene ranking by fold change expression between IGF2BP1-high vs -low samples as in (D). (F) Violin plot of IGF2BP1 mRNA expression in EOC-derived cells, classified as epithelial-like (E, blue) or mesenchymal-like (M, red) by the differential mRNA expression (Cancer Cell Line Encyclopaedia; CCLE expression data) of epithelial (CDH1, KRT8 and/or EPCAM) and mesenchymal (VIM, ZEB1 and/or CDH2) markers. (G) Western blotting of IGF2BP1 and indicated epithelial (blue) and mesenchymal (red) markers. ACTB (beta-actin) served as loading control. (H, I) Immunostaining of CTNNB1 and F-actin using Phalloidin-TRITC in indicated cell lines. Dashed boxes depict enlarged regions. Scale bar 25 µm. The ratio of CTNNB1 membrane to cytoplasmic localization was determined in 15 cells over three independent analyses. (J) 3D growth of indicated cell lines upon IGF2BP1 knockdown (blue) or over-expression (red), as determined by Cell Titre Glo relative to controls and input. Representative images of ES-2 cells expressing GFP or GFP-IGF2BP1 overlaid with growth detection masks (red) and input spheroids (light red) are shown. (K) Invasion of pre-formed Matrigel embedded spheroids of ES-2 cells upon IGF2BP1 knockdown (blue) or over-expression (red) was monitored in an Incucyte S3. Representative images overlaid with invasion detection masks (red) or input spheroids (light red) are shown. Box plots in J and K are derived from analyses of 6–9 spheroids in three independent experiments. Statistical significance was determined by Student’s T-test or Mann-Whitney rank-sum test. *, p < 0.05; ***, p < 0.001
