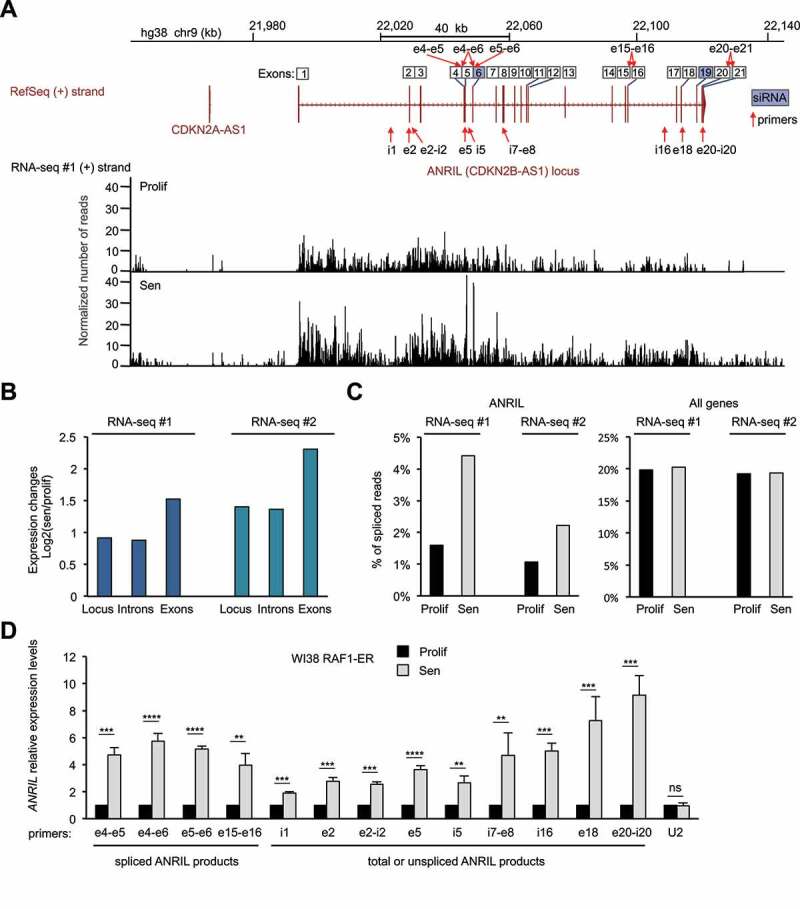
Figure 1.

ANRIL expression increases in a model of RAF1 oncogene-induced senescence
(A) RNA-seq data (from the 1st replicate (RNA-seq#1)) showing expression of the (+) strand at the ANRIL gene, in WI38 hTERT RAF1-ER cells either proliferative (Prolif) or induced to senescence (Sen) by 4-HT treatment, as indicated. Strand-specific RNA-seq tracks show the number of reads per base normalized by the total number of aligned reads multiplied by 100 million. The ANRIL locus is also shown with all the annotated exons from the various transcript variants from the RefSeq database. The primers and siRNAs targeting ANRIL, used in this study, are shown with red arrows and blue squares, respectively. Primers detecting spliced products are shown on top of the exon numbers while primers detecting total (spliced + unspliced) or unspliced ANRIL are shown below the locus. (B) Quantification of the RNA-seq signal from the 1st (RNA-seq #1) and 2nd (RNA-seq #2) replicates at the ANRIL locus, exons or introns. For each analysed region, the mean per base of the normalized number of aligned reads was computed. The ratio of this number in senescence to the number in proliferation was then calculated (log2). (C) Analysis of strand-specific RNA-seq datasets for spliced reads relative to the total number of reads in proliferation or senescence for the ANRIL gene or all expressed genes (15,027 genes analysed as described in the Methods section, showing the median value of the whole population). (D) WI38 hTERT RAF1-ER cells were induced to senescence or maintained proliferative, as indicated. Seventy-two hours later, total RNA was extracted, and ANRIL expression was measured by RT-qPCR using the indicated primers. U2 ncRNA was measured as a control whose expression does not change in RAF1-induced senescence. The means and standard deviations from four independent experiments are shown, relative to GAPDH and normalized to 1 in proliferative cells for each experiment (before calculating the mean between experiments, to compare the variations in expression changes between the different regions). Significant differences are indicated with asterisks (*: p value < 0.05, ** to ****: p values < 10−2, 10−3 and 10−4, respectively; two-sided paired Student’s t-test on log2 values). i = introns, e = exons, ns = not significant.
