
Figure 2.
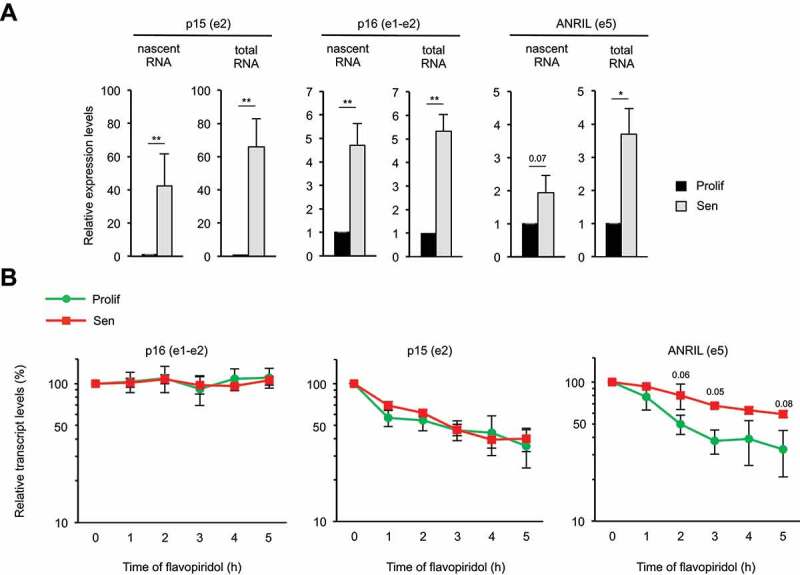
ANRIL is stabilized in senescence
(A) WI38 hTERT RAF1-ER cells were induced to senescence or maintained proliferative, as indicated. Seventy-two hours later, cells were treated with EU for 1 h, total RNAs were extracted and EU labelled nascent RNAs were purified using the Click-iT technology. Total and nascent p15, p16 and ANRIL levels were measured by RT-qPCR using the primers indicated in parentheses. The means and standard deviations from three independent experiments are shown, relative to GAPDH (e9) and normalized to 1 in proliferative cells for each experiment. Significant differences are indicated with asterisks (*: p value < 0.05, ** to ****: p values < 10−2, 10−3 and 10−4, respectively; two-sided paired Student’s t-test on log2 values) or by the number of the p value when it is between 0.05 and 0.1. (B) WI38 hTERT RAF1-ER cells were induced to senescence or maintained proliferative, as indicated. Seventy-two hours later, cells were treated with flavopiridol to inhibit transcription for the indicated times. p15, p16 and ANRIL expression was monitored by RT-qPCR using the indicated primers at the indicated times following flavopiridol addition. The levels of RNA were normalized to those of GAPDH (e9) and then normalized to 100% at 0 time point for each experiment. The means and standard deviations from three independent experiments are shown (logarithmic scale). Significant differences were calculated as in (A); not significant p values are not indicated.