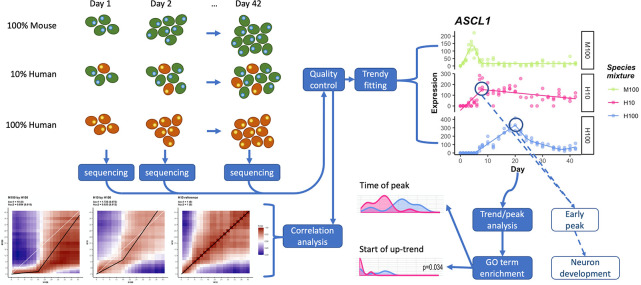
Fig 1. Overview of data collection/analysis pipeline.
(top left) Human (red) and mouse (green) cells are cultured at various mixing proportions over a 42 day neural differentiation time course, harvesting samples every 1–2 days for RNA-seq. Low quality biological replicates are removed from analysis and the data are normalized. (top right) Normalized data are fit to segmented regression built for RNA-seq data (Trendy) and temporal gene characteristics, such as peak times, are identified. (bottom right) Classified gene sets are further analyzed, including enrichment analysis for GO terms which are temporally accelerated or otherwise systematically altered in H10 compared to H100. (bottom left) In parallel to the previous analysis, normalized data are also correlated between time courses to identify transcriptome-wide effects.

