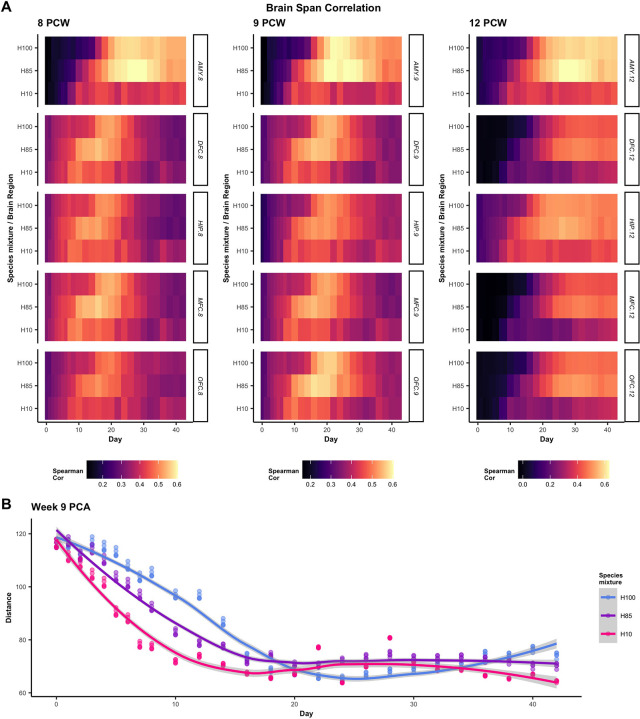
Fig 5. Comparison with Brain-Span regions further demonstrates a dose-response in acceleration effects.
(A) Correlations (Spearman) between fitted trends and Brain-Span data are calculated at three Brain-Span time points and across the five brain regions represented at all three times. Calculations are performed on a subset of highly dynamic genes (see Materials and Methods). (B) Dissimilarity (PCA-based distance, see Materials and Methods) between species mixtures and each of the 5 reference brain regions are computed for each day and smoothed to estimate a continuous dissimilarity metric over time.

