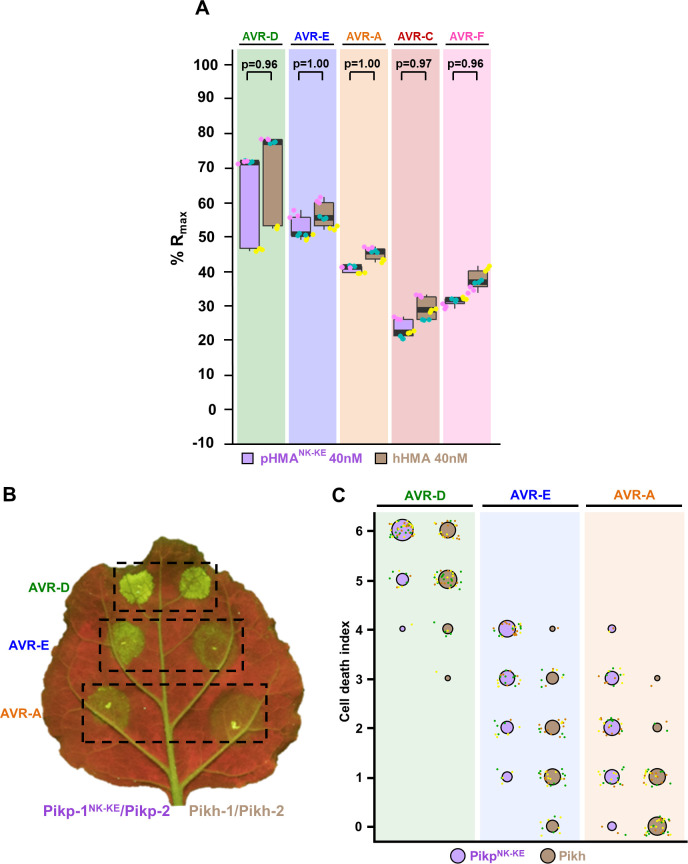
Fig 6. Pikh and PikpNK-KE display similar binding affinity for AVR-Pik effectors but Pikh shows a reduced response in planta.
(A) Pikp-HMANK-KE and Pikh-HMA binding to AVR-Pik effector variants determined by surface plasmon resonance. The binding is expressed as %Rmax at an HMA concentration of 40 nM. Pikp-HMANK-KE and Pikh-HMA are represented by purple and brown boxes, respectively. For each experiment, three biological replicates with three internal repeats each were performed and the data are presented as box plots. The centre line represents the median, the box limits are the upper and lower quartiles, the whiskers extend to the largest value within Q1–1.5× the interquartile range (IQR) and the smallest value within Q3 + 1.5× IQR. All the data points are represented as dots with distinct colours for each biological replicate. “p” is the p-value obtained from statistical analysis and Tukey’s HSD. Data for Pikh-HMA is also presented in Fig 2B and were collected side-by-side at the same time. For results of experiments with 4 and 100 nM HMA protein concentration see S7 Fig. (B) Representative leaf image showing a side-by-side responses for Pikp-NK-KE and Pikh with AVR-PikD, AVR-PikE and AVR-PikA. (C) In planta response scoring represented as dot plots. Fluorescence intensity is scored as previously described in [20,21]. Responses mediated by PikpNK-KE and Pikh are coloured in purple and brown, respectively. For each sample, all the data points are represented as dots with a distinct colour for each of the three biological replicates; these dots are jittered about the cell death score for visualisation purposes. The size of the centre dot at each value is directly proportional to the number of replicates in the sample with that score. The total number of repeats was 57. For statistical analysis of the differences between the responses mediated by PikpNK-KE and Pikh see S8 Fig.

