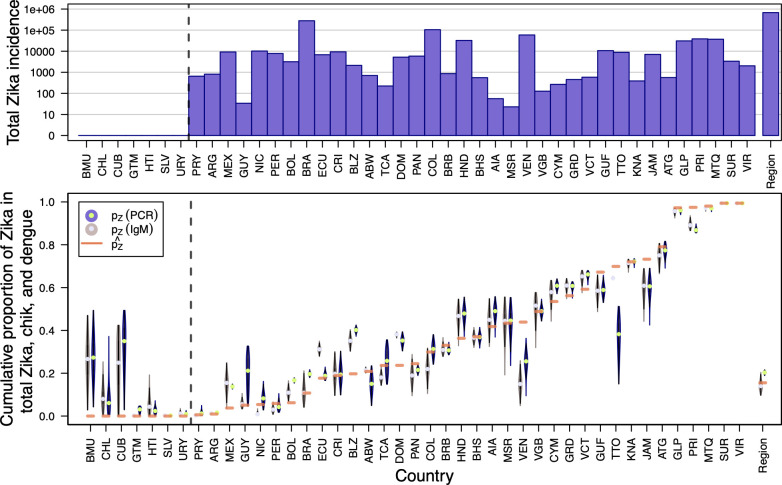
Fig 5. Revised estimates of cumulative pZ versus empirical by country.
Countries to the left of the dotted line reported zero confirmed or suspected Zika cases according to PAHO. Top: Total reported Zika cases by country on a log10 scale. Bottom: Violin plots of cumulative pZ assuming confirmed cases arose from PCR-RT or IgM tests only, with empirical indicated with a horizontal orange line. The distributions of pZ were estimated using temporally disaggregated data for each country and were then were aggregated for visualization. Region-wide estimates (i.e., aggregated across all 43 countries) are shown farthest to the right.

