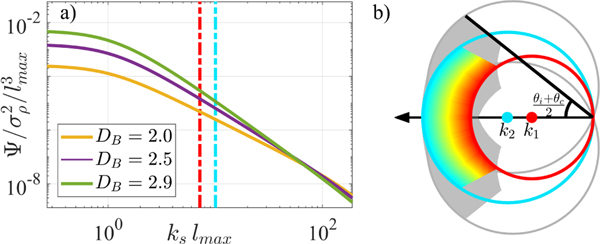
Fig. 2.
(a)The normalized PSD Ψ is shown, where the dashed lines indicate the back-scattered frequencies for visible light illumination. (b) Ewald representation of back-scattered frequency space with NAi of 0.55 and NAc of 1.49. Colored region depicts wavelengths 500–700nm for planar illumination, while greyed region incorporates the response from the entire NAi.

