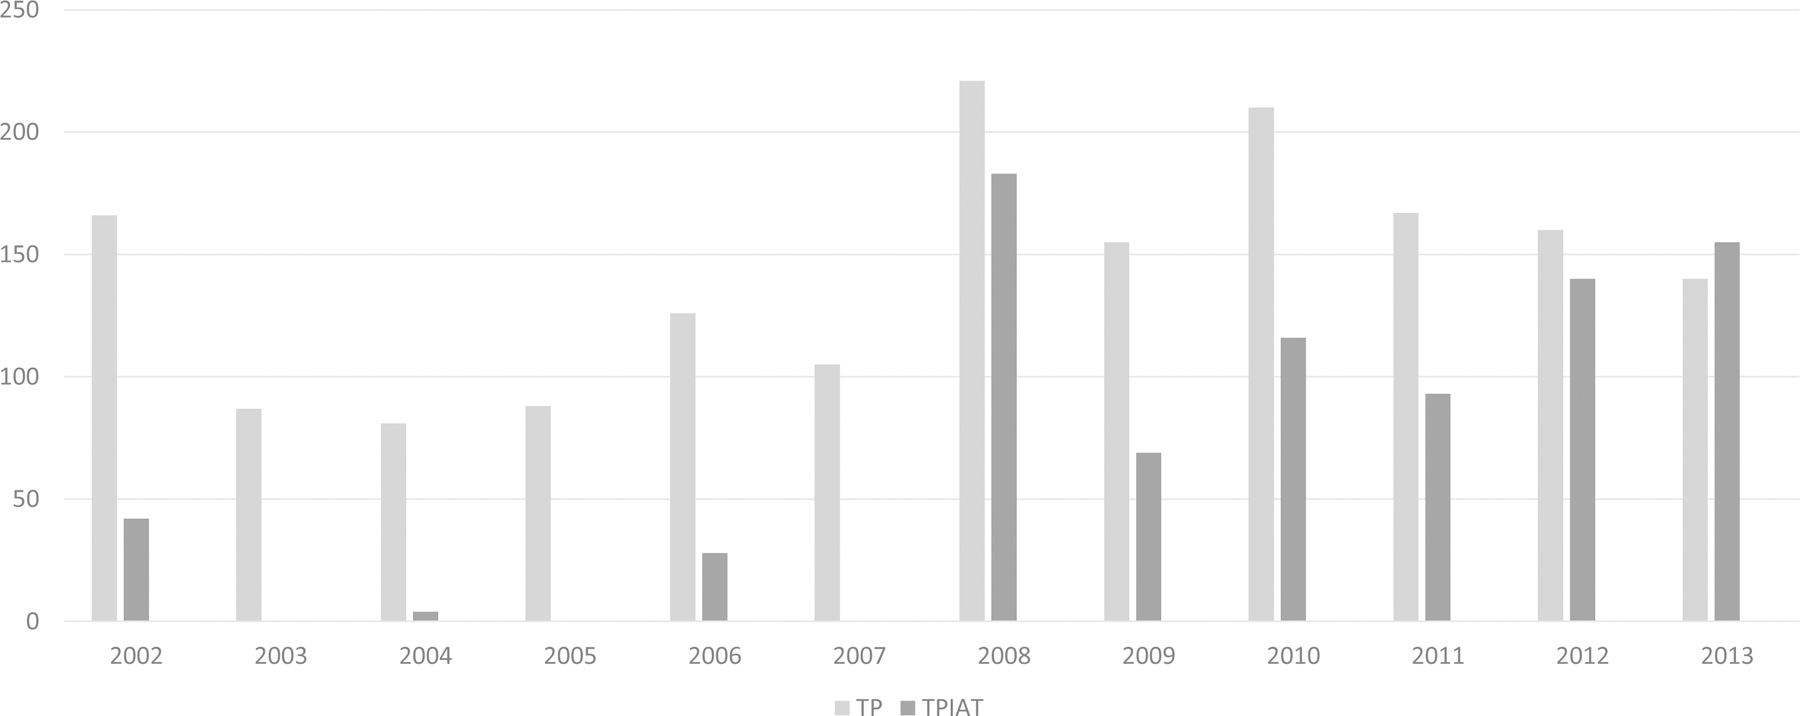
FIGURE 2.

The bar-graph shows the trend of TP and TPIAT in patients with chronic pancreatitis during the study period 2002–2013 according to census derived geographical areas of the United States. Cell sizes <10 were not reported as they might not reflect a difference between groups. Cochran-Armitage test indicates a significant trend for TPIAT in all regions, P < 0.001
