
Fig. 3.
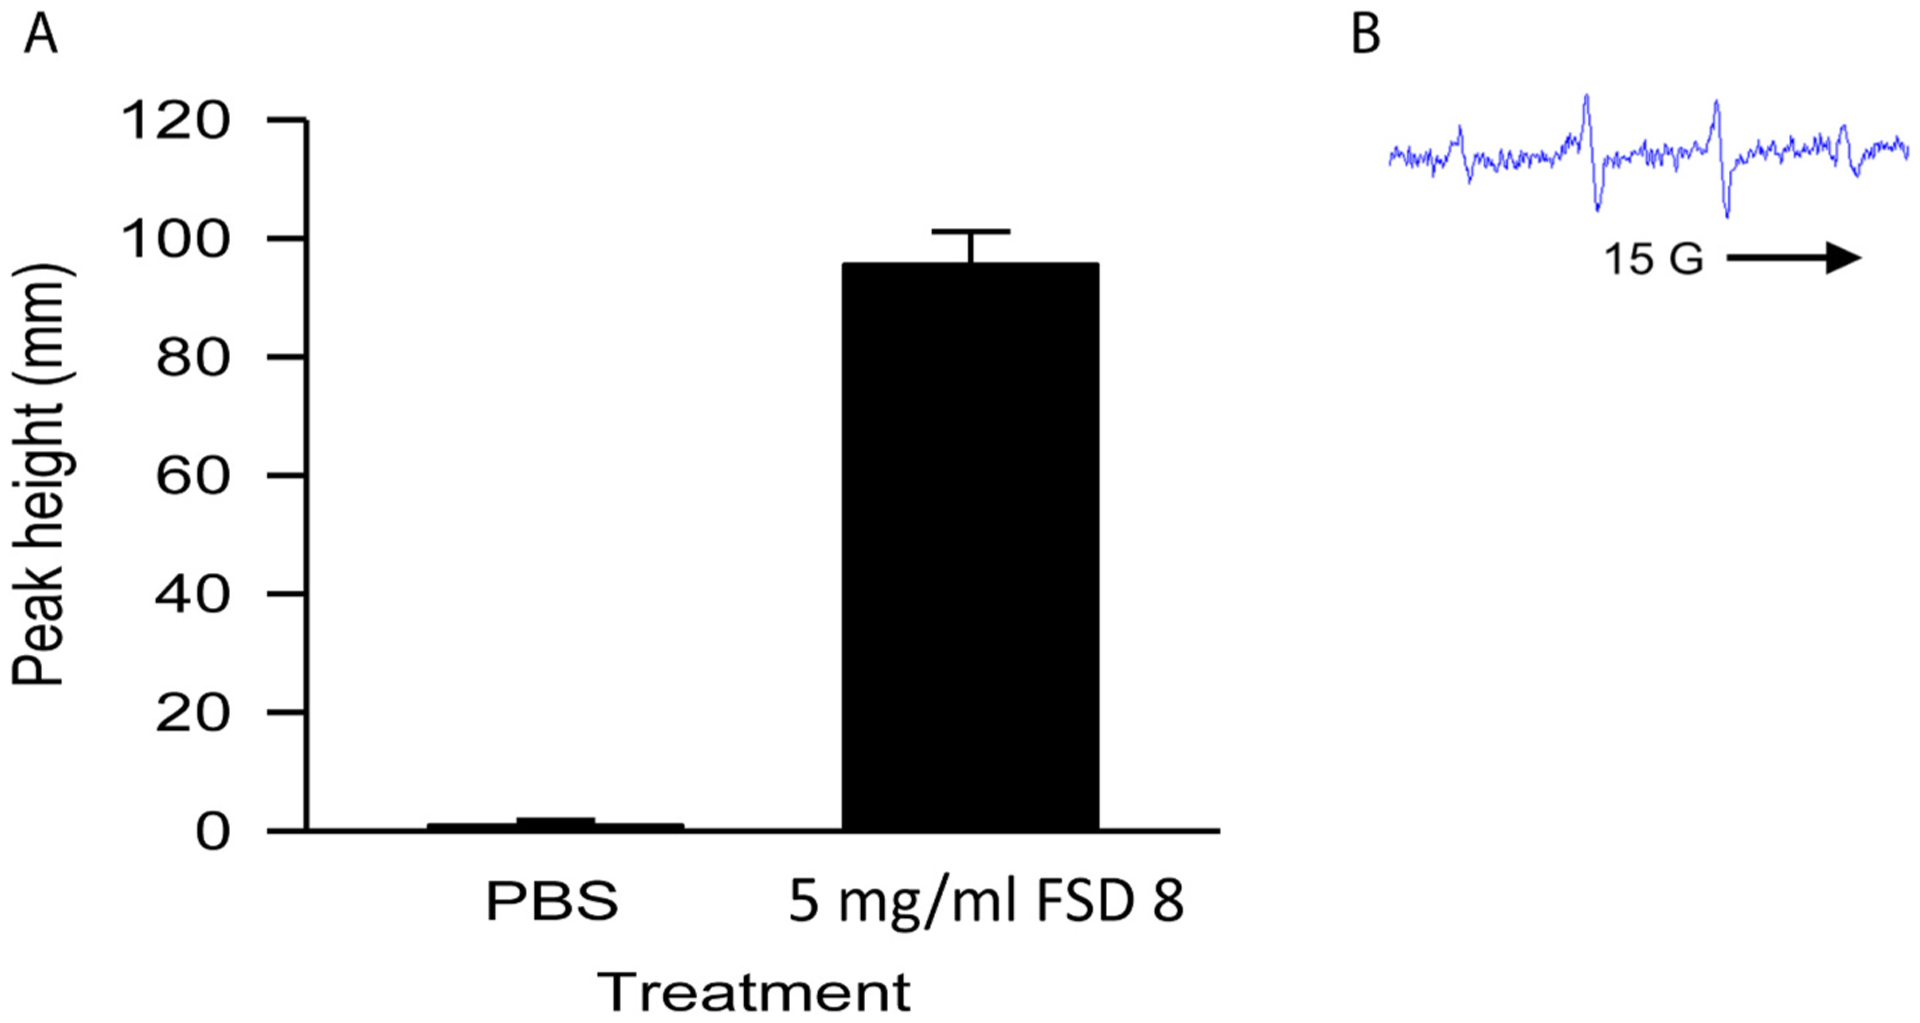
˙OH production stimulated by FSD 8 in an acellular system. Signal intensity (peak height) was used to measure by ESR the relative amounts of ˙OH produced. A) Fenton-like reactions were carried out in an acellular system using FSD 8 suspensions. B) Representative spectra is shown. aFSD 8 vs. PBS.