
Fig. 3. ACC→NAc projections bidirectionally control social transfer of pain.
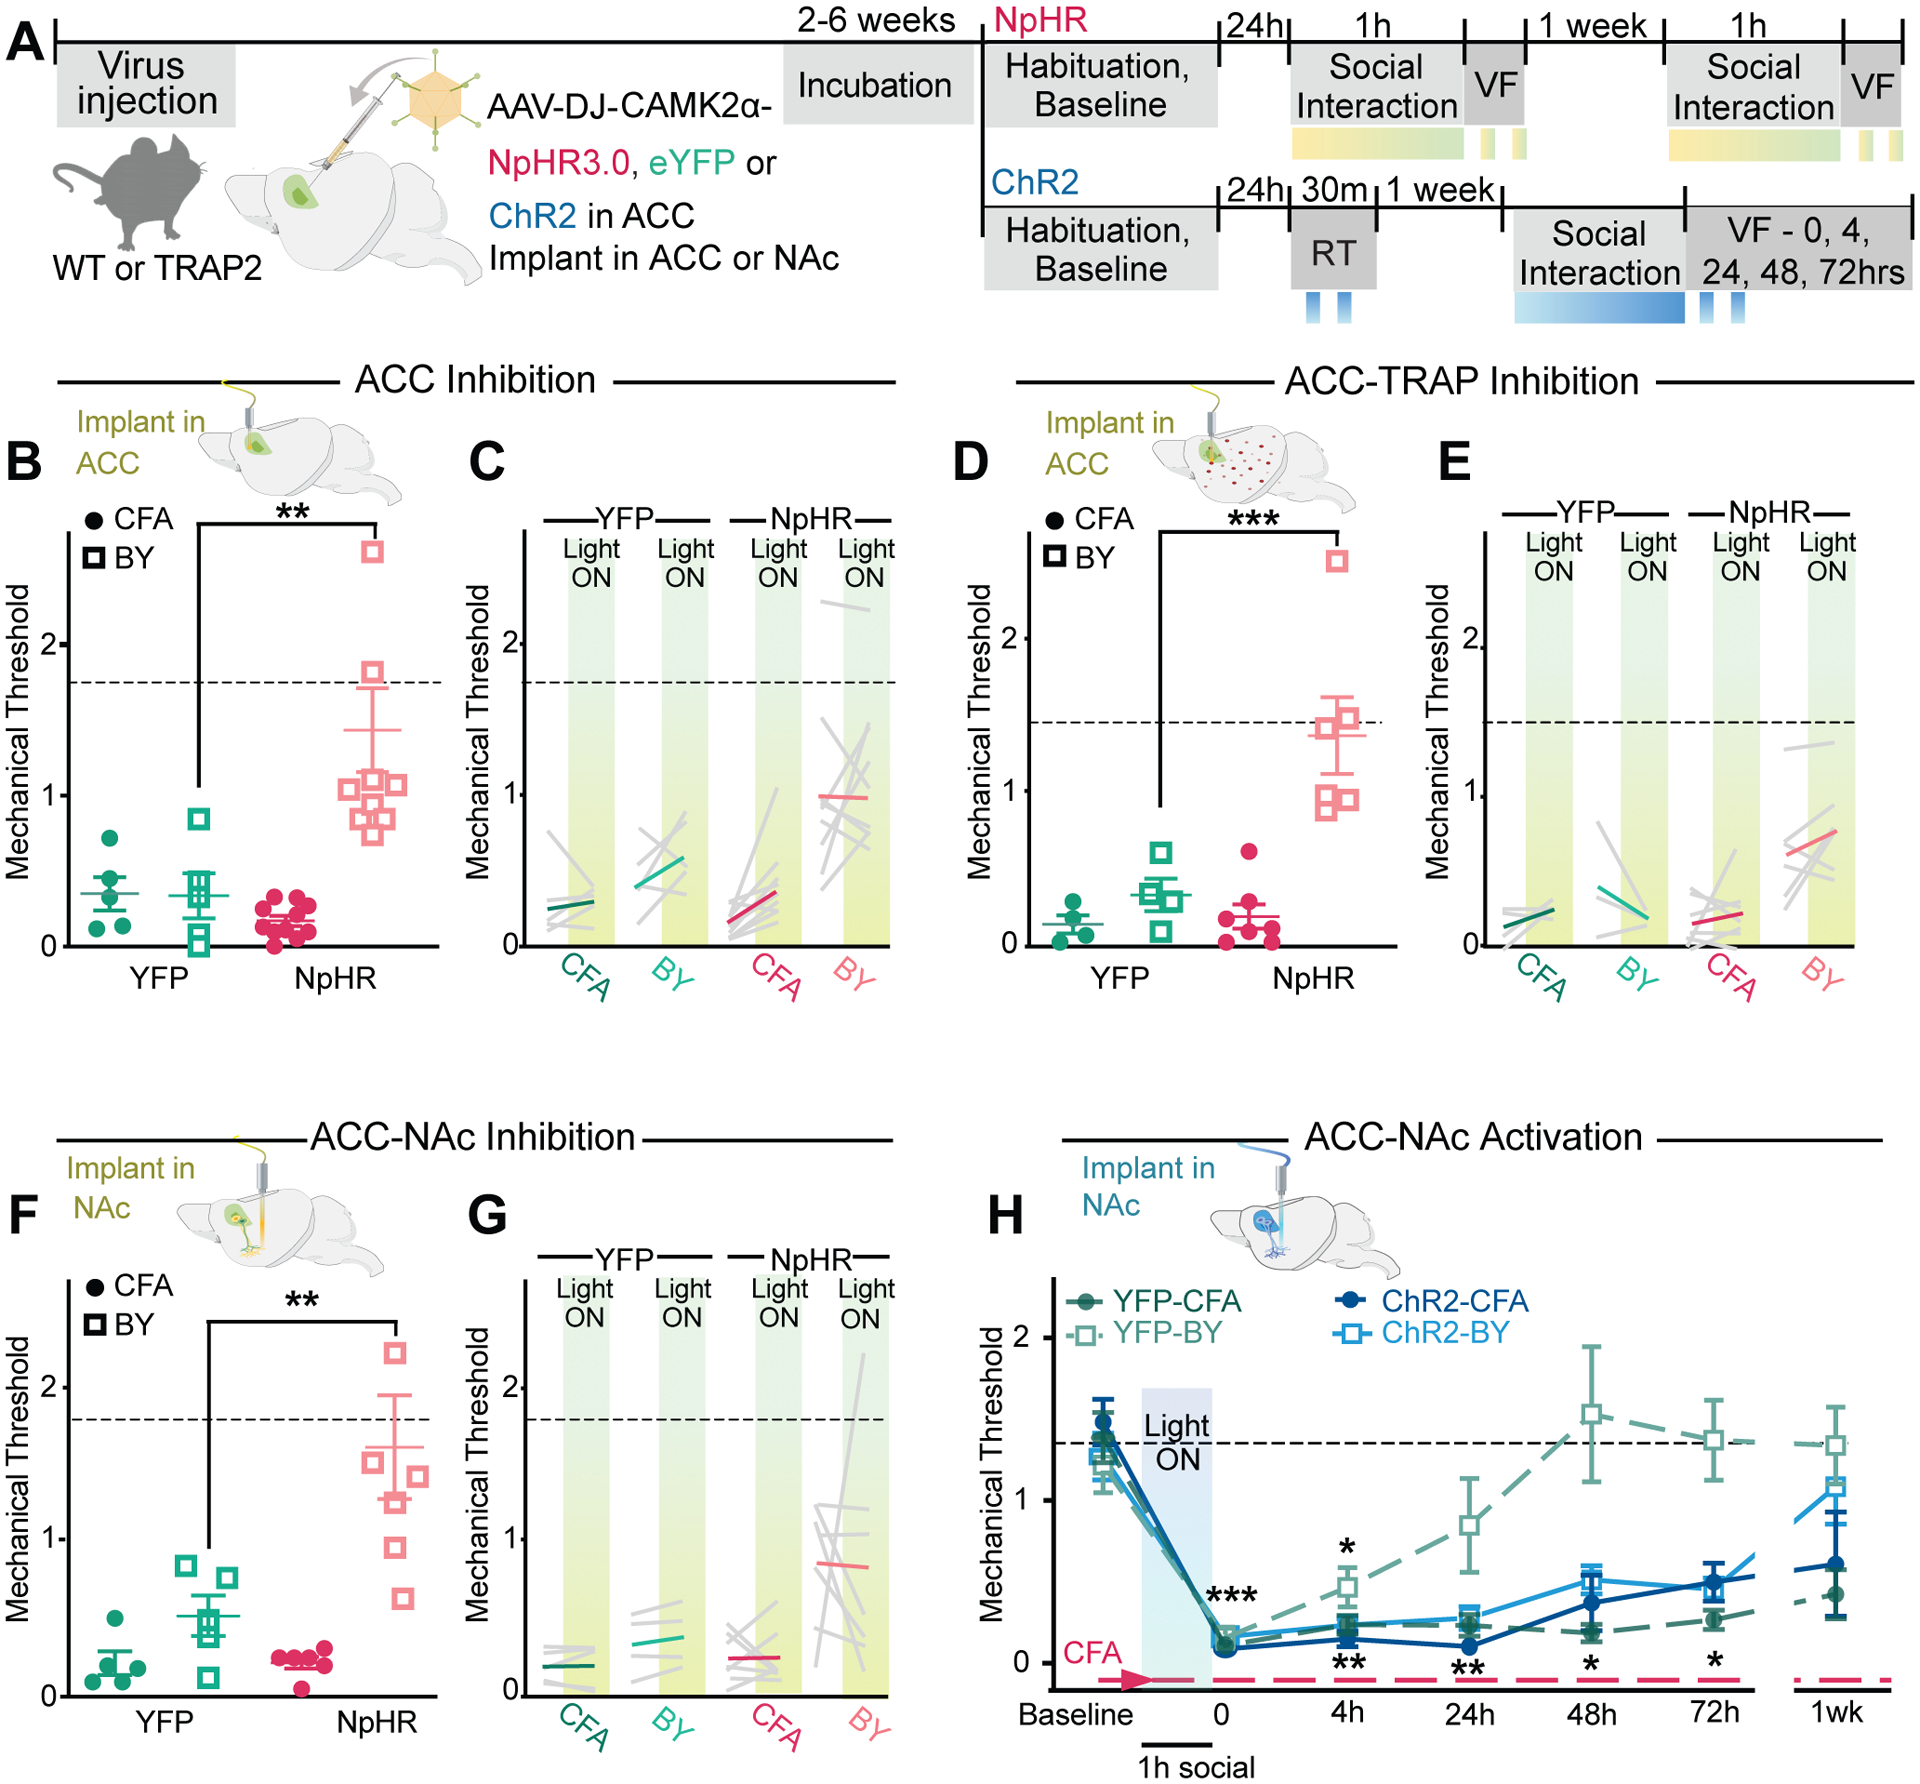
(A) Schematic of viral injection and experimental timeline. Light stimulation (~5–15 mW, 8 s on/2 s off) periods represented by yellow-green boxes. (B) Schematic shows fiber optic implant above the ACC. First light off test of mechanical sensitivity (VF) of YFP and NpHR injected mice immediately after 1 h social transfer with ACC inhibition. (C) Mechanical sensitivity during averaged (n=2) light off and light on sessions of ACC inhibition. (D) Schematic shows fiber optic implant above the ACC. First light off test of mechanical sensitivity of YFP and NpHR injected TRAP2 mice immediately after 1 h social transfer with ACC-TRAP inhibition. (E) Mechanical sensitivity during averaged (n=2) light off and light on sessions of ACC-TRAP inhibition. (F) Schematic of bilateral fiber optic implants above the NAc core. First light off test of mechanical sensitivity of YFP and NpHR injected mice immediately after 1 h social transfer with ACC→NAc input inhibition. (G) Mechanical sensitivity during averaged (n=2) light off and light on sessions of ACC→NAc input inhibition. (H) First light off test of mechanical sensitivity at 0, 4, 24, 48, 74 h and 1 wk post 1 h social interaction with ACC→NAc input inhibition. Data are means ± s.e.m. Dotted line (---) represents mean baseline thresholds for all groups. *P < 0.05, **P < 0.01, ***P < 0.001, **** P < 0.0001; One-way ANOVA with Holm-Sidak post hoc tests comparing YFP to matched NpHR groups (B–G) and two-way repeated measures ANOVA with Holm-Sidak post hoc tests comparing treatment groups to baseline at each timepoint, notation is the least significant p value of all comparisons (H). All statistical measure details are presented in Table S1C.