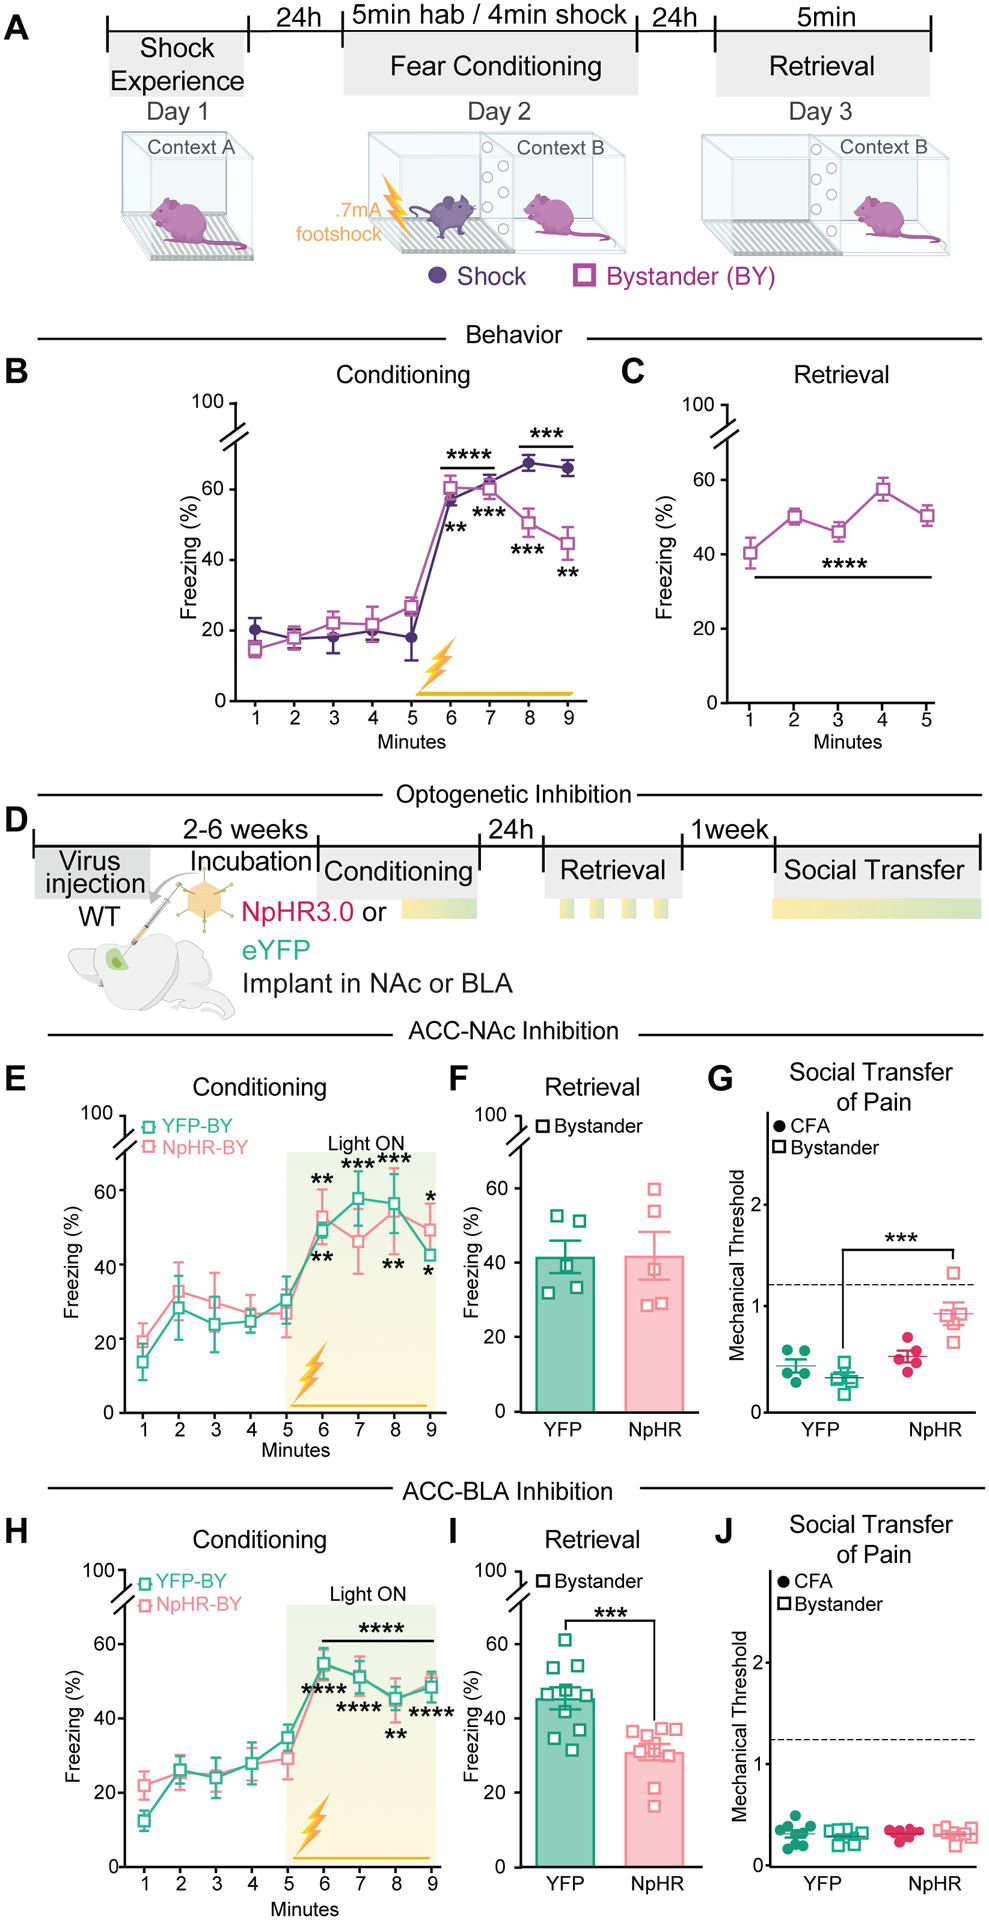
Fig. 4. Distinct ACC projections control the social transfer of pain and fear.

(A) Schematic and timeline of social transfer of fear (Shock Experience: 2 × 0.7 mA, 2 s duration, 1 min intervals; Shock Conditioning: 24 × 0.7 mA for 2 s duration, 10 s intervals, total of 4 min). (B) Freezing behavior of Shock and Bystander (BY) during conditioning phase of socially transferred fear. (C) Freezing behavior of BY mice during retrieval phase of socially transferred fear. (D) Schematic of YFP and NpHR injection and experimental timeline of optogenetic stimulation in NAc or BLA. Light stimulation (~10–15 mW, 8 s on/2 s off) periods represented by green boxes. (E) Conditioning session with inhibition of ACC→NAc projections in YFP- and NpHR-BY mice during shock observation. (F) Freezing behavior of YFP- and NpHR-BY mice during retrieval phase. (G) First light off session measuring mechanical sensitivity following NpHR inhibition of ACC→NAc projections during social transfer of pain in the same mice from E, F. Dotted line (---) represents mean baseline of all groups. (H) Conditioning session with inhibition of ACC→BLA projections in BY mice during shock observation. (I) Freezing behavior of YFP- and NpHR-BY mice during retrieval phase. (J) First light off session measuring mechanical sensitivity following NpHR inhibition of ACC→BLA projections during social transfer of pain in the same mice from H, I. Dotted line (---) represents mean baseline of all groups. Data are means ± s.e.m. *P < 0.05, **P < 0.01, ***P < 0.001, ****P < 0.0001. Two-way repeated measures ANOVA with Holm Sidak post hoc tests comparing freezing to the first minute, notation is the least significant p value of all comparisons (B, E, H), paired t-test (C) or unpaired t-test (F,I) comparing average baseline to average freezing during retrieval, or one-way ANOVA with Holm-Sidak post hoc tests (G,J). All statistical measure details are presented in Table S1D.
