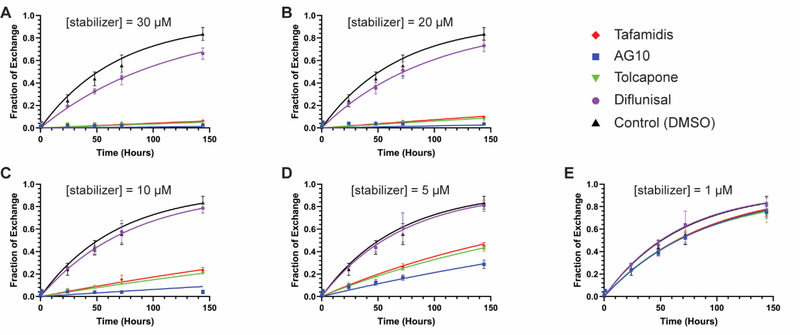
Figure 2. TTR subunit exchange kinetics in the presence of kinetic stabilizers at varying concentrations, experiments 1 and 2 combined.
Time courses of subunit exchange between endogenous plasma TTR (~ 3 μM) and added dual-flag-tagged WT-TTR (1 μM) in the presence of kinetic stabilizers at the indicated concentrations. Data from experiments 1 and 2 were combined and fit globally. The x-axis shows time in hours; the y-axis shows the fraction of exchange as calculated from the area under peak 3 in ion exchange chromatograms (see Figure 1C for a sample chromatogram and the Materials and Methods for the procedure to calculate fraction exchange). (A) Subunit exchange time courses in the presence of kinetic stabilizers at a concentration of 30 μM. (B) As in panel A, but at a stabilizer concentration = 20 μM. (C) As in panel A, but at a stabilizer concentration = 10 μM. (D) As in panel A, but at a stabilizer concentration = 5 μM. (E) As in panel A, but at a stabilizer concentration = 1 μM. The same DMSO control time course is shown in each plot. Red diamonds = tafamidis; blue squares = AG10; inverted green triangle = tolcapone; purple circle = diflunisal; black triangle = DMSO control. Data points represent the mean and error bars the standard deviation of the combined data set from experiments 1 and 2. The curves in each plot represent the best fits to the combined data based on the model described in the text.

