
Fig. 2.
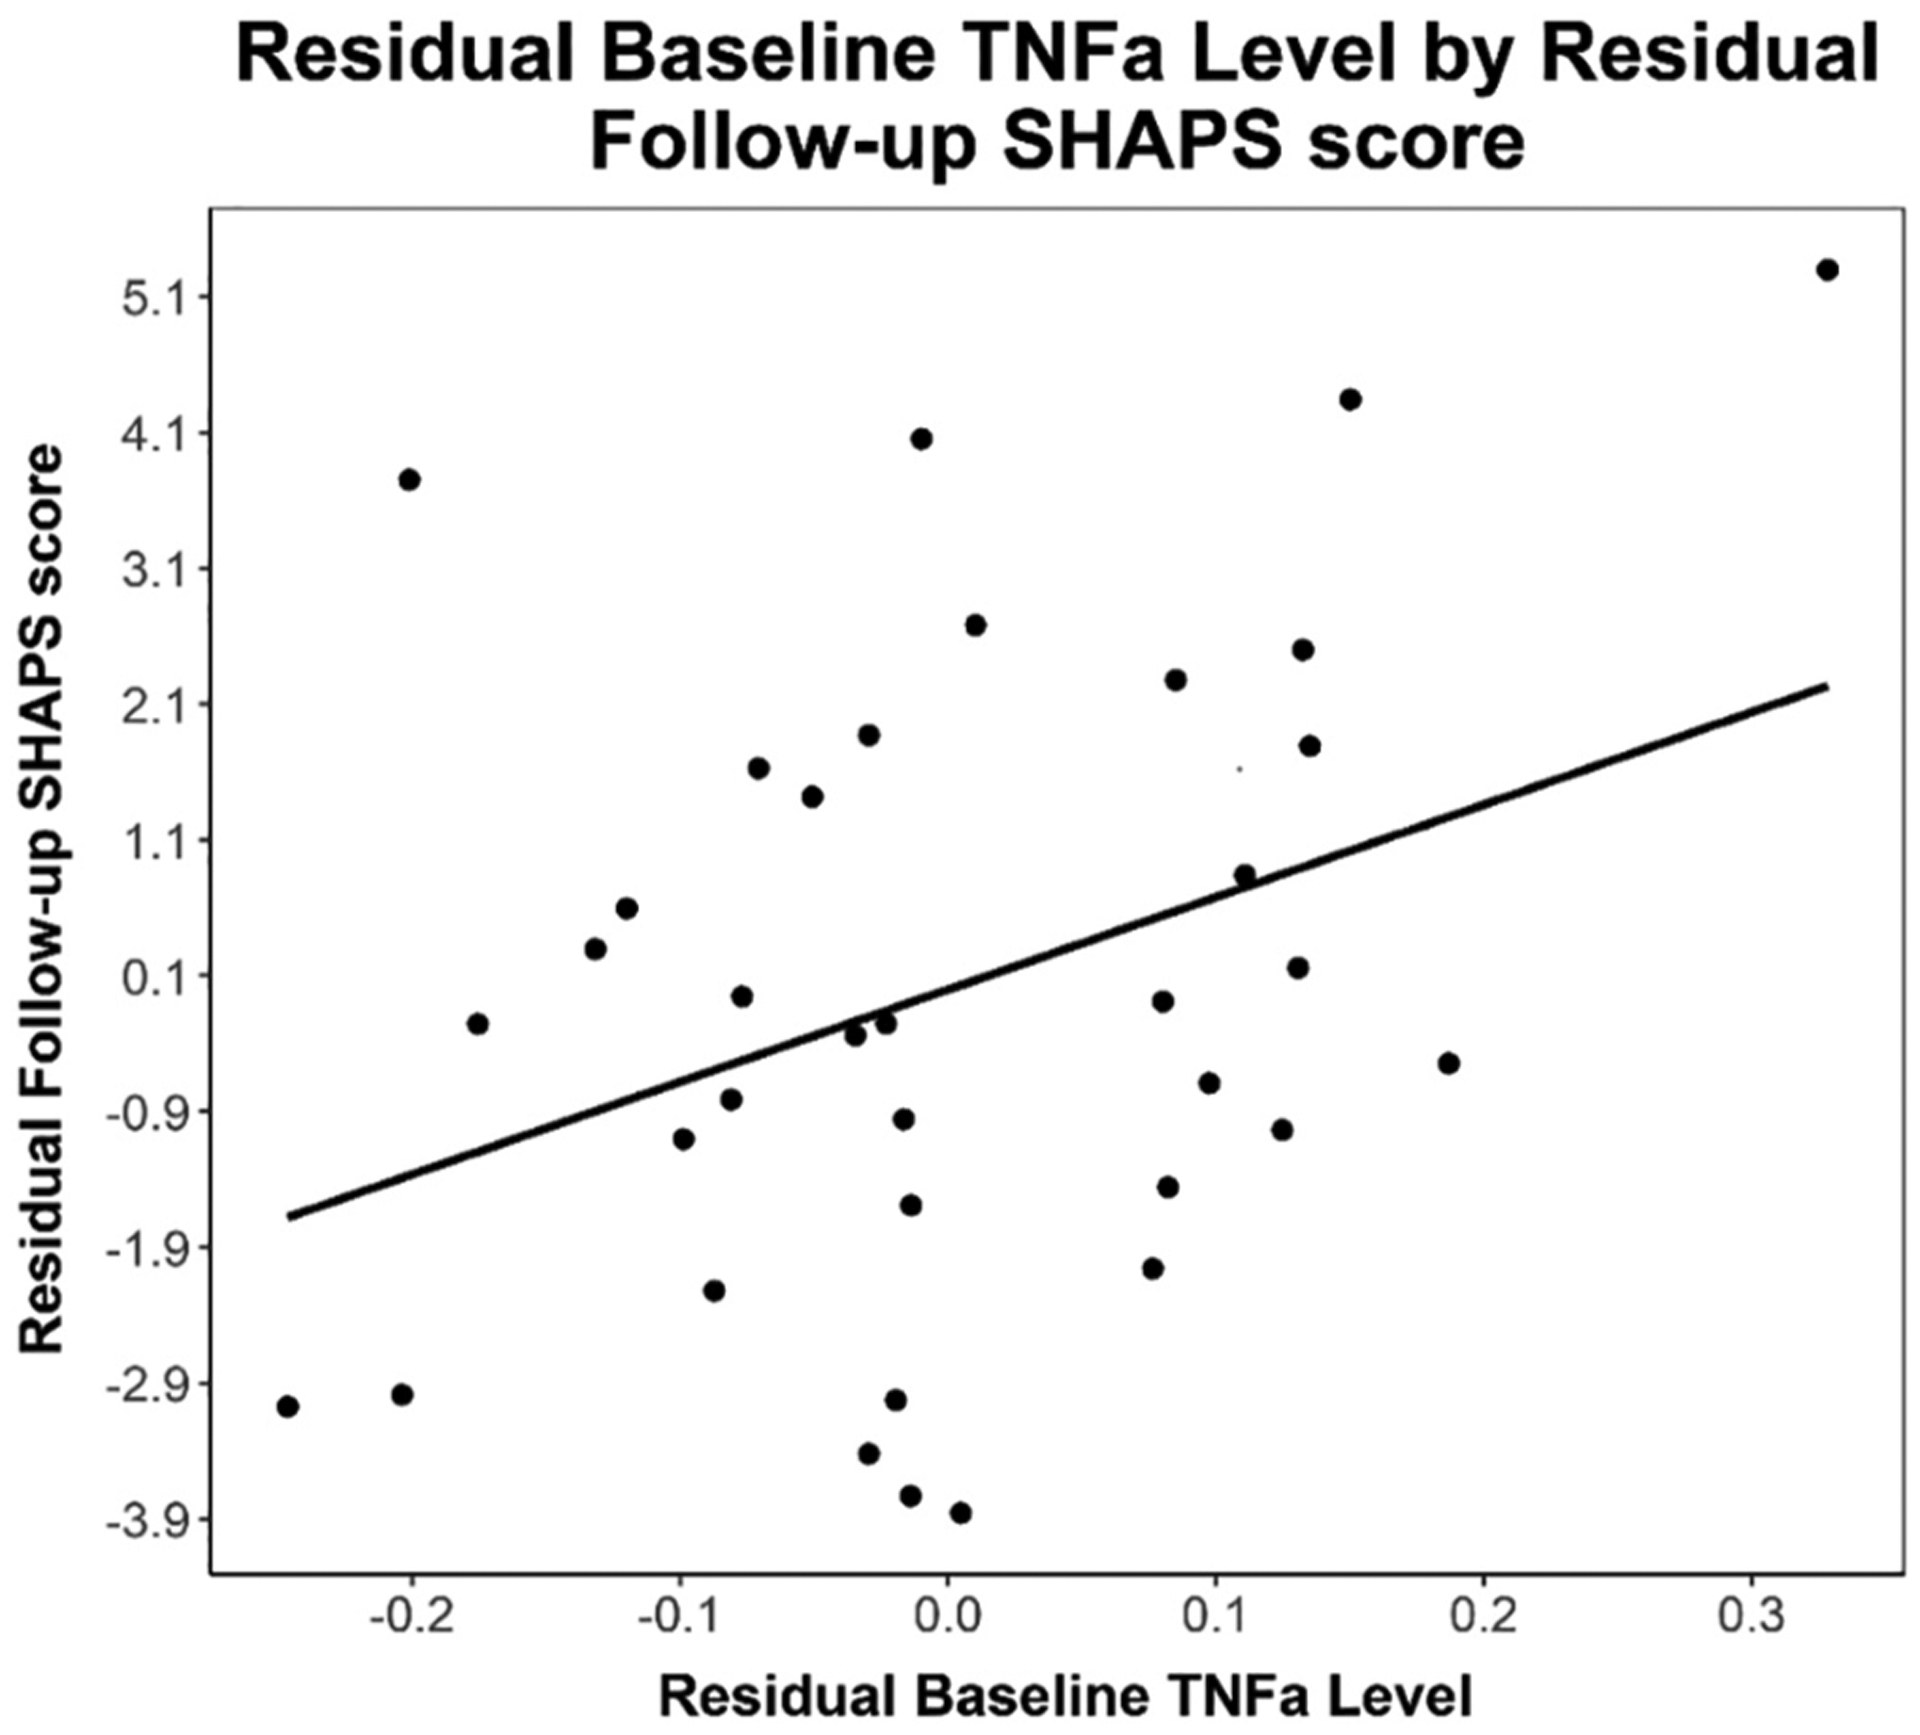
Note. Partial regression plot of residual baseline TNFα levels by residual follow-up SHAPS anhedonia scores. Partial regression plot is provided to visualize relationship between independent and dependent variable while statistically adjusting for BMI, biological sex, and baseline SHAPS anhedonia scores. Line of best fit provided for descriptive purposes (Equation: Follow-Up SHAPS Residual = 6.8 * Baseline TNFα Residual).