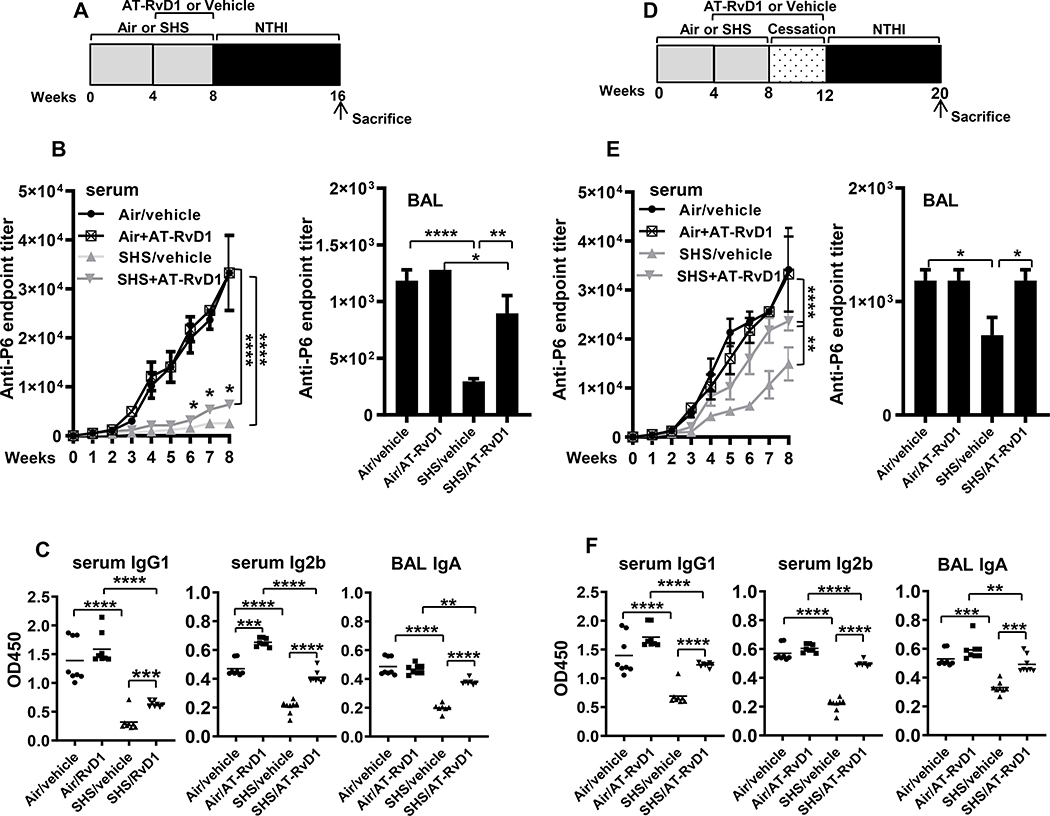
FIGURE 3. AT-RvD1 treatment of SHS-exposed mice enhances antigen-specific antibody responses, which further are augmented by a period of cessation.
(A) C57BL/6J mice were exposed to air or SHS for 8 wks, with or without AT-RvD1 treatment given in the last 4 wks of exposure, and then subjected to the chronic infection model for 8 wks, as described. (B) Total anti-P6 IgG antibodies were measured by ELISA in serum (left panel) collected weekly during the period of chronic NTHI infection and in end-point BAL (right panel) collected at the time of euthanasia. (C) Levels of antigen-specific Ab subclasses IgG1 and IgG2b in end-point (wk 8) serum (left and middle panels) and IgA in BAL collected at euthanasia (right panel) were measured by determining OD450 values at dilutions of 1:1600 for serum and 1:400 for the BAL by ELISA assays as described in methods. (D) C57BL/6J mice were exposed to air or SHS for 8 wks, followed by a 4-wk period of cessation. Mice were treated with AT-RvD1 or vehicle between wks 4–12, encompassing part of the period of SHS exposure and period of cessation. All mice were chronically infected with NTHI by i.t. instillations starting at wk 12 as described in methods. (E) Total anti-P6 IgG antibodies were measured in weekly serum (left panel) and end-point BAL (right panel) by ELISA. (F) Levels of antigen-specific Ab subclasses IgG1 and IgG2b in end-point serum (left and middle panels) and IgA in end-point BAL (right panel) were determined by measuring the OD450 values for serum at 1:1600 dilution and for the BAL at 1:400 dilution by ELISA assays as described in methods. Line represents mean value for the group. All treatment groups were performed at the same time, and data represent results generated from a single experiment using a total of n=7–10 mice/group. The results are shown as mean ± SE. Statistical significance was determined by either two-way ANOVA with Tukey’s posttest for multiple comparisons (B and E, left panels) or by two-tailed unpaired students t test (all other figures), **p<0.01, ***p<0.001, ****p<0.0001.

