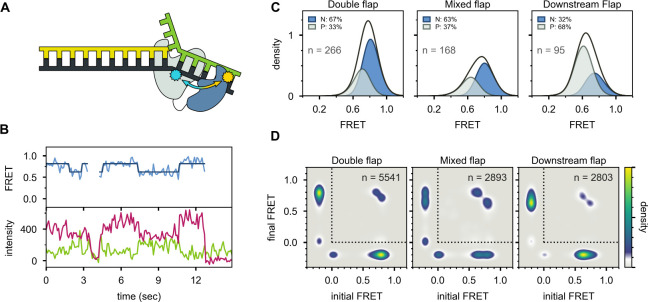
Figure 5. Probing the location of the 5’ nuc domain within Pol I bound to flap substrates.
(A) Schematic representation of donor (yellow, attached to 5’ nuc domain) and acceptor (cyan, attached to downstream template strand) labeling sites. (B) Representative set of donor, acceptor and FRET trajectories for mixed flap DNA substrate. The bold lines are idealized state paths from Hidden Markov modeling. (C) FRET efficiency histograms compiled from n individual FRET trajectories. (D) Transition density plots compiled from a total of n transitions. Since the FRET efficiency is not defined during periods when Pol I is not bound to DNA, the FRET efficiency is set to −0.2. The quadrant enclosed by the dotted lines corresponds to periods during which Pol I is bound to DNA.

