Figure 22.

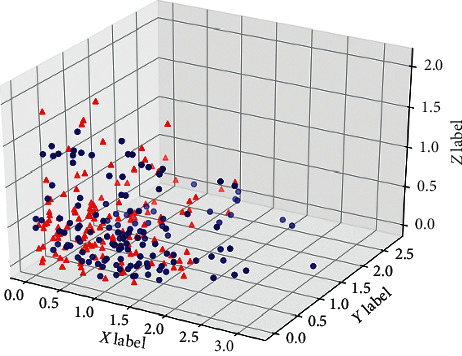
Three-dimensional diagram of PCA results of meridional potential signal (the red points represent the electric potential signals at meridian acupoints, and the green ones represent the standard ECG signals).

Three-dimensional diagram of PCA results of meridional potential signal (the red points represent the electric potential signals at meridian acupoints, and the green ones represent the standard ECG signals).