
Figure 22.
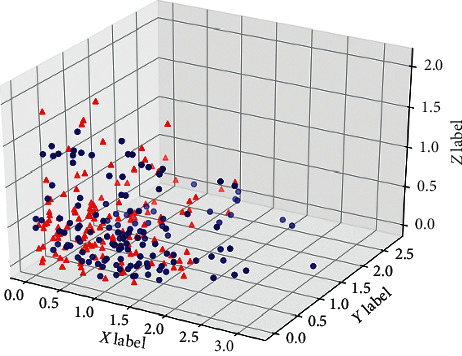
Three-dimensional diagram of PCA results of meridional potential signal (the red points represent the electric potential signals at meridian acupoints, and the green ones represent the standard ECG signals).
Official websites use .gov
A
.gov website belongs to an official
government organization in the United States.
Secure .gov websites use HTTPS
A lock (
) or https:// means you've safely
connected to the .gov website. Share sensitive
information only on official, secure websites.
Three-dimensional diagram of PCA results of meridional potential signal (the red points represent the electric potential signals at meridian acupoints, and the green ones represent the standard ECG signals).