Figure 2.

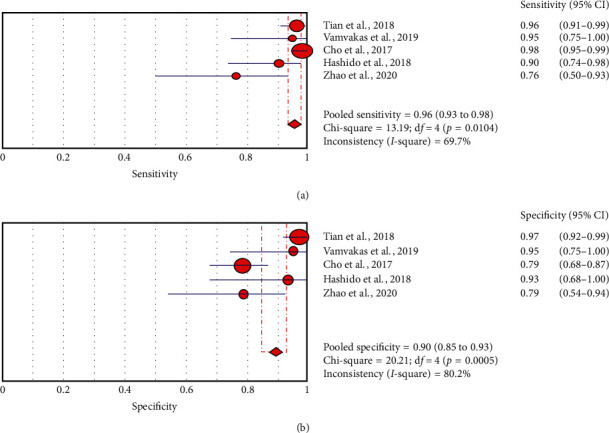
Pooled estimation of sensitivity and specificity for the diagnostic accuracy of radiomics using machine learning in differentiating HGG from LGG. Circles and horizontal lines represent the point estimate and 95% confidence intervals.

Pooled estimation of sensitivity and specificity for the diagnostic accuracy of radiomics using machine learning in differentiating HGG from LGG. Circles and horizontal lines represent the point estimate and 95% confidence intervals.