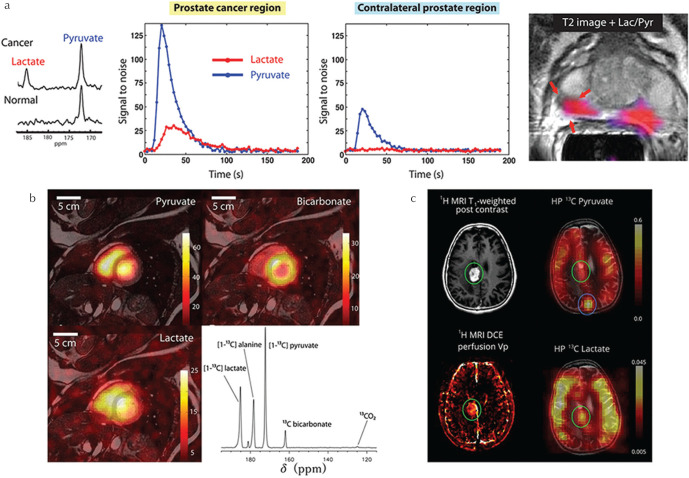
Fig. 4.
Clinical examples of hyperpolarized [1-13C]pyruvate MRI. (a) Representative dynamic 13C MRS data of pyruvate and lactate signal in prostate cancer region and contralateral prostate region of a prostate cancer patient, and lactate/pyruvate signal ratio map overlaid on a T2-weighted 1H MR image (adapted from Figs. 2 and 4, respectively of Nelson et al.4 reprinted with permission from the American Association for the Advancement of Science (AAAS)). (b) HP [1-13C]pyruvate, lactate and bicarbonate MR images and a non-selective MR spectrum of the healthy human heart (adapted from Figs. 1 and 3, respectively of Cunningham et al.80 reprinted with permission from Wolters Klumer Health, Inc). (c) Comparison of HP [1-13C]pyruvate and lactate MR images to contrast-enhanced T1-weighted MRI and perfusion plasma volume mapping in a patient with recurrent glioblastoma (adapted from Fig. 4 of Miloushev et al.85 permission from the American Association for Cancer Research (AACR)).

