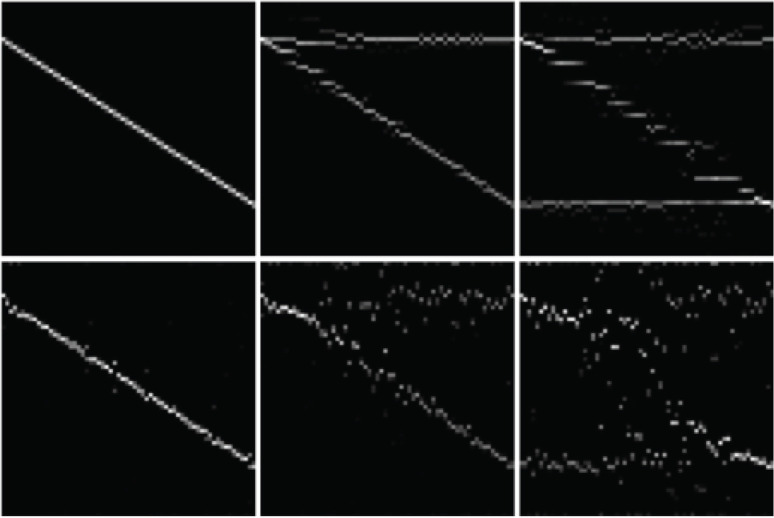
Fig. 4.
This shows the results of numerical simulation of NNLS decomposition. Top row: without noise. Bottom row: Gaussian noise with SD of 1% of peak signal. From left to right: one, two, and three T2 components. Within each image, horizontal axis corresponds to pixel position, longitudinal axis corresponds to T2 value. Actual T2 values for each index are: 0 → 60.0, 5 → 124.6, 10 → 258.6, 15 → 537.0, 20 → 1114.9, 24 → 2000.0 (ms). NNLS, non-negative least squares.

