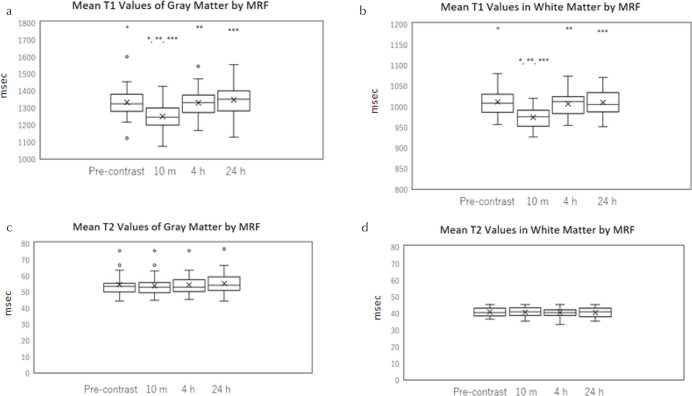
Fig. 5.
A box-and-whisker plot of the T1 and T2 values in cerebellar gray and white matter for pre-administration, and 10 min, 4 and 24 h post-intravenous administration of gadolinium-based contrast agent as measured by MR fingerprinting (MRF). T1 of the gray matter (a), T1 of the white matter (b), T2 of the gray matter (c), T2 of the white matter (d). The mean T1-value of gray and white matter at 10 min was significantly smaller than that at all the other time points (a and b). *, **, ***: Significant difference. There was no significant change in the mean T2 value over time in either gray or white matter (c and d). The lower side of the rectangle is the first quartile (25th percentile value) and the upper side is the 75th percentile value. The horizontal line in the rectangle is the median. The horizontal line under the whisker indicates the 10th percentile value, and the horizontal line above the whisker indicates the 90th percentile value. The cross sign in the rectangle is the mean.

