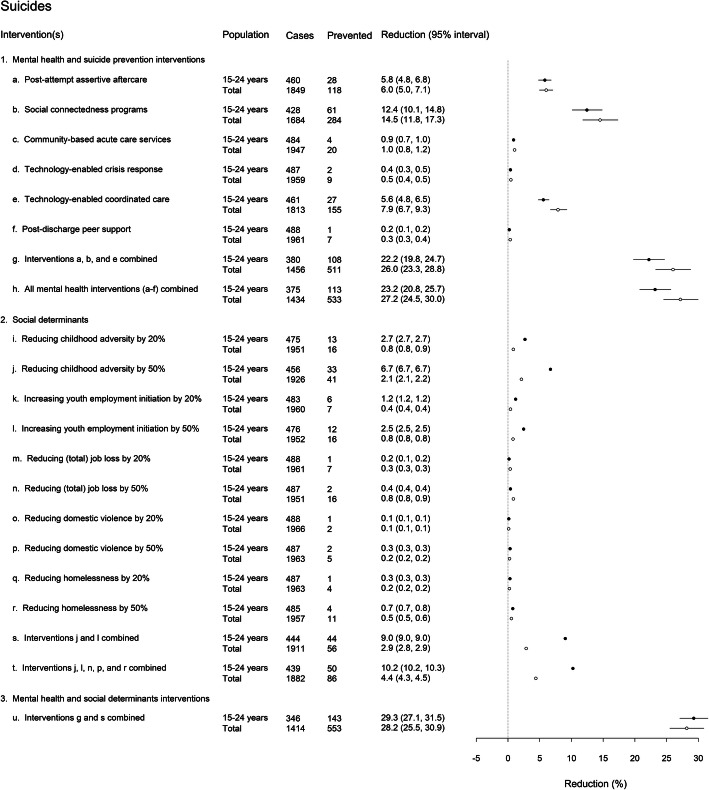
Fig. 3.
Differences in projected total (cumulative) numbers of suicides between the baseline and intervention scenarios (2021–2041). Numbers of cases (i.e. suicides) and cases prevented are rounded to the nearest integer and were obtained assuming the default parameter values. Mean percentage reductions and 95% intervals reported in the rightmost column and plotted on the right were derived from the distributions of projected outcomes calculated in the sensitivity analyses (note that the 95% intervals provide a measure of the impact of uncertainty in the assumed intervention effects but should not be interpreted as confidence intervals)

