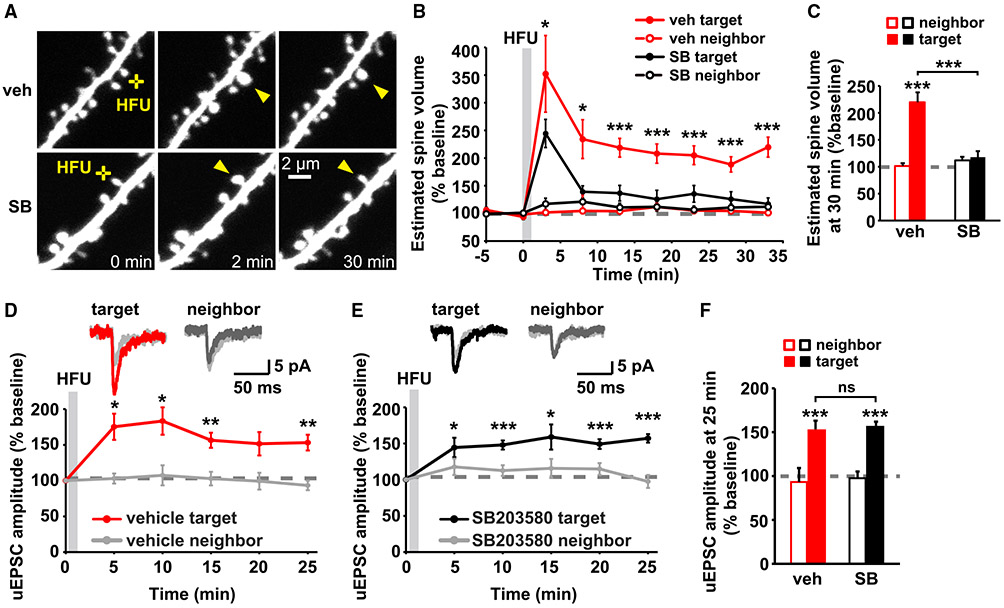
Figure 1. p38 MAPK activity is required for LTP-induced spine growth, but not for synaptic strengthening.
(A) Images of dendrites from DIV14-18 EGFP-expressing CA1 neurons from rat organotypic slices before and after HFU stimulation (yellow crosses) at individual dendritic spines (yellow arrowheads) with and without p38 MAPK inhibitor SB203580 (SB, 2 μM).
(B and C) Inhibition of p38 MAPK with SB (black-filled circles/bar; 11 spines/11 cells) reduced HFU-induced spine growth compared with vehicle (red-filled circles/bar; 11 spines/11 cells). Volume of unstimulated neighbors (open circles/bars) was unaffected.
(D and E) Top, average traces of uEPSCs from a target spine and an unstimulated neighbor on CA1 neurons from mouse organotypic slices before (gray) and 25 min after HFU stimulation during vehicle conditions (target, red; neighbor, dark gray) or in the presence of SB (target, black; neighbor, dark gray). Bottom, HFU-induced increases in uEPSC amplitude in vehicle (red; 8 spines/8 cells) were unaffected by p38 MAPK inhibition with SB (black; 9 spines/9 cells). uEPSC amplitudes of unstimulated neighboring spines (gray) were unaffected.
(F) HFU induced a long-lasting uEPSC amplitude increase (red filled bar) compared with baseline, which is unaffected by p38 MAPK inhibition (black-filled bar).
Two-way ANOVA with Tukey’s test used in (C) and (F) and two-way repeated-measures (RMs) ANOVA with Dunnett’s test to baseline used in (B), (D), and (E). Data are represented as means ± SEM. *p < 0.05, **p < 0.01, ***p < 0.001.

