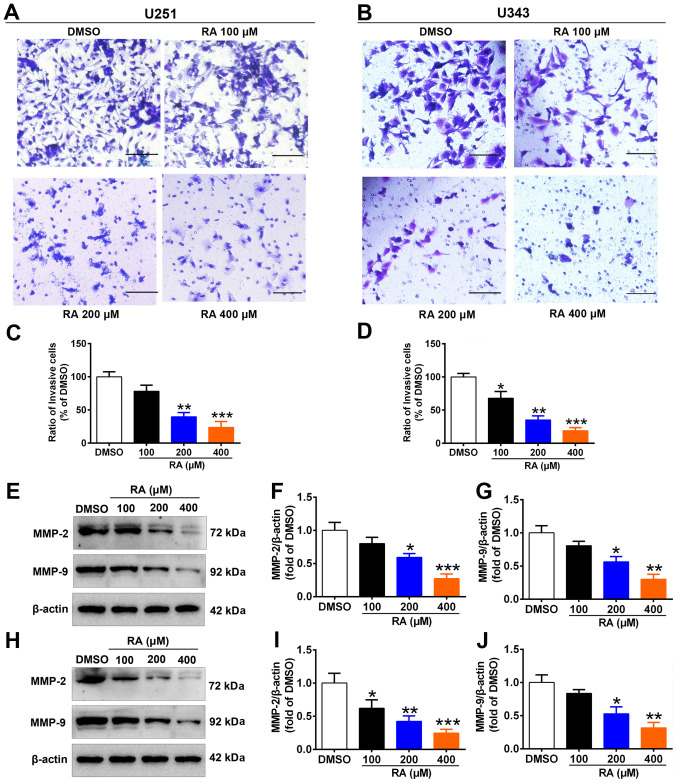
Figure 5.
RA reduces glioma cell invasion and inhibits the expression of related factors. (A) Images of U251 cells after treatment with the indicated concentrations of RA for 24 h. Scale bar, 50 µm. (B) Images of U343 cells after treatment with indicated concentrations of RA for 24 h. Scale bar, 50 µm. (C) Percentage of invasive U251 cells. (D) Percentage of invasive U343 cells. (E) The expression levels of MMP-2 and MMP-9 were detected by western blotting in U251 cells after treatment with the indicated concentrations of RA for 24 h. (F and G) Densitometric quantification of the bands in E. (H) The expression levels of MMP-2 and MMP-9 were detected by western blotting in U343 cells after treatment with the indicated concentrations of RA for 24 h. (I and J) Densitometric quantification of the bands in H. The histogram indicates the mean ± SD of three independent experiments. *P<0.05, **P<0.01 and ***P<0.001 vs. the DMSO group. RA, rosmarinic acid.

