Figure 2.
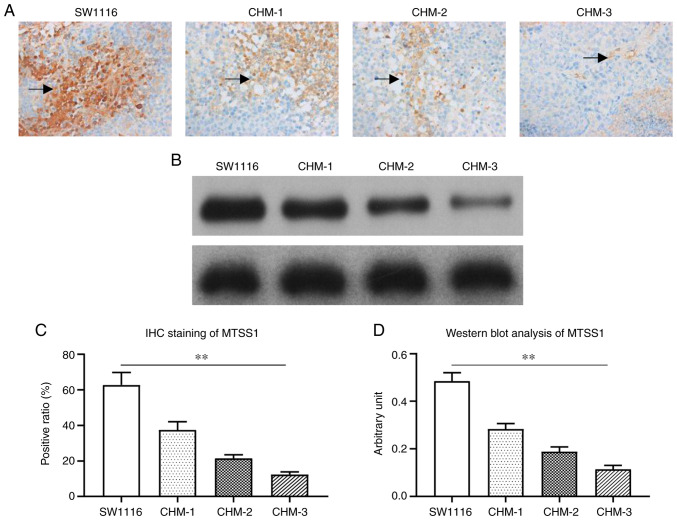
MTSS1 expression levels are downregulated in CHM-1, CHM-2 and CHM-3 cells compared with the parental SW1116 cells. (A and C) Immunohistochemical staining of MTSS1 expression levels in liver lesions (indicated by black arrows) formed from SW1116, CHM-1, CHM-2 and CHM-3 cells. (B and D) Western blot analysis was used to analyze MTSS1 expression levels in liver lesions formed from the SW1116, CHM-1, CHM-2 and CHM-3 cells. Data are presented as the means ± SD; n=3; **P<0.01. MTSS1, metastasis suppressor 1.

