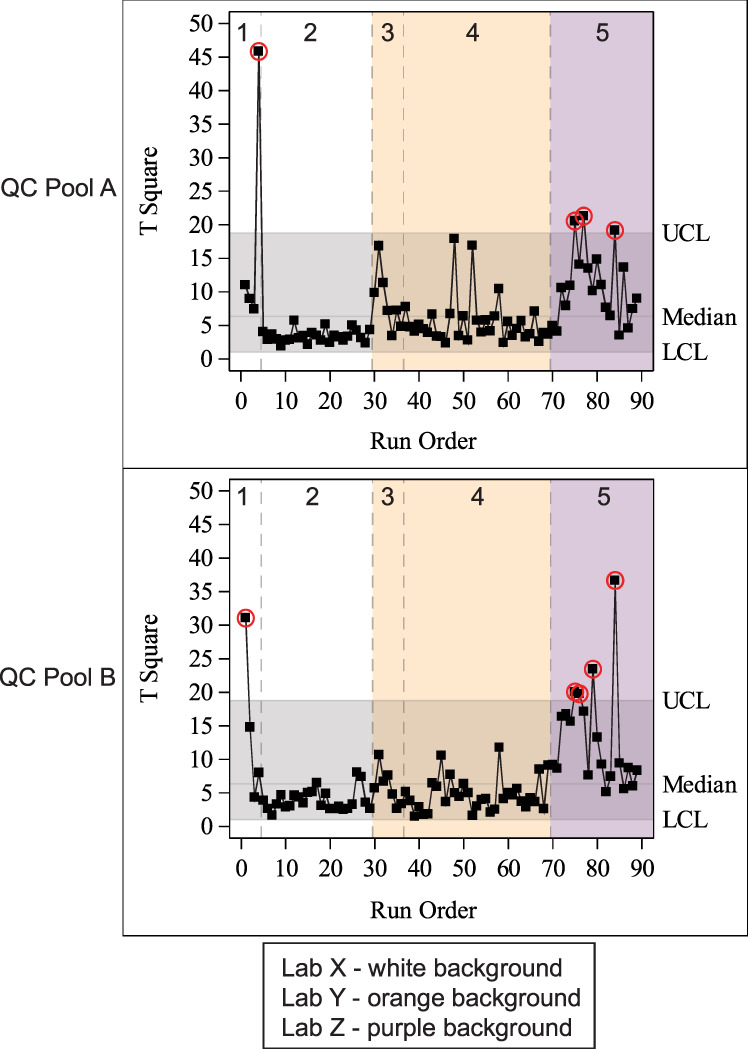
Fig. 3. Multivariate control charts for 7 phthalates run for the CHEAR QC pools A (top panel) & B (bottom panel) from a combination of five CHEAR studies assessed by three different CHEAR lab hubs.

The control charts show the T2 statistic plotted by run order for each study. The area shaded in gray represents the in control range with reference lines for the median, upper confidence limit (UCL) and lower confidence limit (LCL). Batches from separate studies are separated by a vertical dotted line and labeled with the study number. White plot background indicates a study analyzed by Lab Y (studies 1 and 2), the orange indicates a study analyzed by Lab Y (studies 3 and 4), and purple Lab Z (study 5). Out of control runs are circled in red (color figure online).
