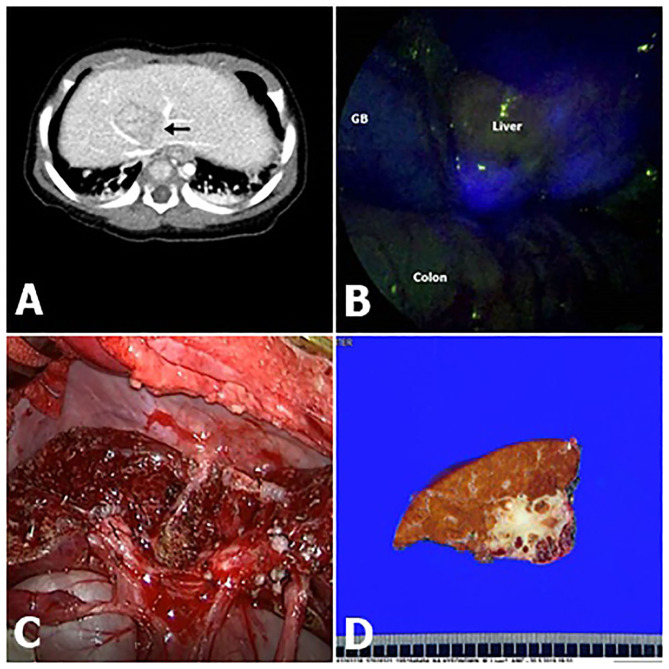
Figure 2.
Fluorescence imaging following intravenous ICG (indocyanine green) demonstrated clear delineation (Pt. No. 11 in Table 1). (A) Computed tomography (CT) shows that hepatoblastoma (HB) was attached to major vessels. (B) Intraoperative ICG fluorescence imaging technique showed bright signals at the HB lesion with an uneven pattern. (C) Gross morphology. (D) A photograph of the liver slide of HB, showing that the resection margin is very delicate.

