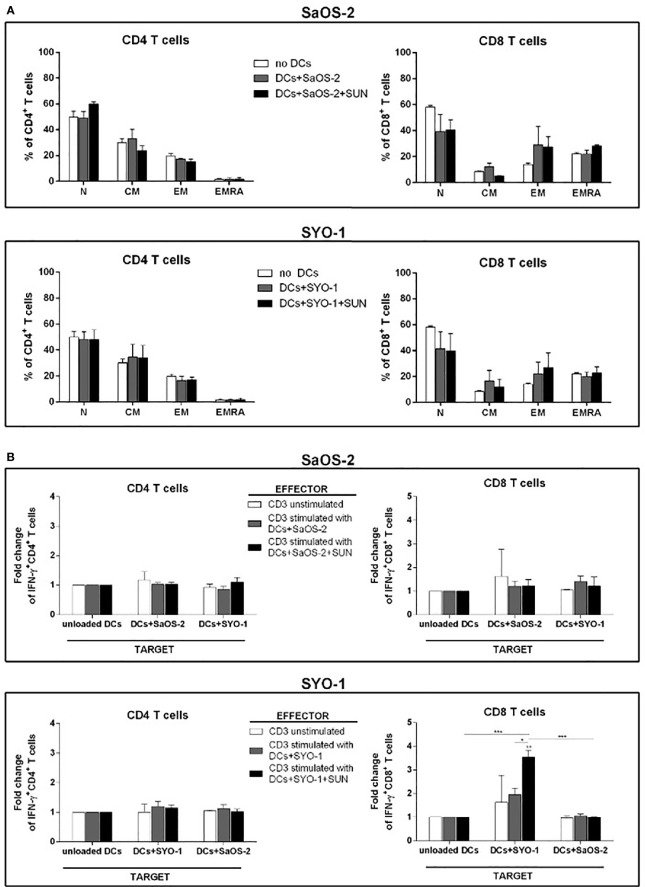
Figure 3.
Flow cytometry analysis of T-cell subpopulations and IFN-γ producing T cells induced by DCs loaded with sunitinib-treated sarcoma cells. SaOS-2 and SYO-1 cell lines were left untreated or treated for 24 h with sunitinib (SUN) at concentrations of 20 μM and 15 μM, respectively, and used for monocyte-derived DC pulsing for another 24 h at a ratio of 1:2 (DC:sarcoma cell). DCs loaded with untreated and irradiated SaOS-2/SYO-1 (DCs+SaOS-2/SYO-1) or sunitinib-treated cells (DC+SaOS-2/SYO-1+SUN) were used to stimulate autologous CD3+ effector T cells at a ratio of 1:10 (DC:T cell). (A) After 5 days, the percentages of naïve (N), central memory (CM), effector memory (EM) and terminally differentiated EM expressing RA (EMRA) in both CD4+ and CD8+ T cells induced by DCs loaded with SaOS-2 or SYO-1 cell lines were evaluated by flow cytometry. Unstimulated CD3+ T cells (no DCs) were used as negative control. The values are represented as mean ± SEM of 5 independent experiments. (B) After 7 days, the T-cell stimulation was repeated (restimulation). Unstimulated CD3+ effector T cells were used as negative effector control. 24 h after restimulation, the IFN-y test was performed (see IFN-γ Production by T Cells) and the percentages of IFN-γ-producing CD3/CD4+ and CD3/CD8+ SaOS-2- or SYO-1-reactive effector T cells were evaluated by flow cytometry and expressed as fold change. DCs loaded with SaOS-2 and SYO-1 cell lysate (DC+SaOS-2 and DC+SYO-1; target) were used as specific (the same cell line with respect to effector stimulus) and unspecific (different cell line with respect to effector stimulus) targets, while unloaded DCs were used as negative target control and the values of IFN-γ-producing T cells against unloaded DCs were used as reference and set at 1. The values are represented as mean ± SEM of 5 independent experiments; *p < 0.05; **p < 0.01; ***p < 0.001.

