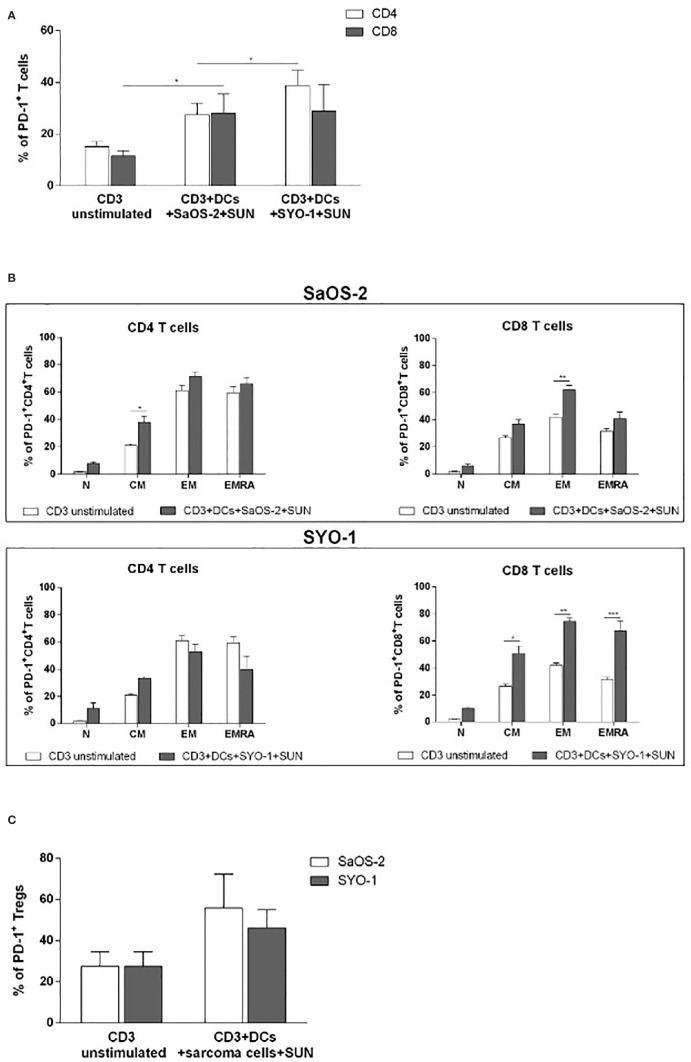
Figure 5.
Flow cytometry analysis of PD-1 expression on T cells induced by DCs loaded with sunitinib treated sarcoma cells. SaOS-2 and SYO-1 cell lines were treated for 24 h with sunitinib (SUN) at concentrations of 20 μM and 15 μM, respectively, and used for monocyte-derived DC pulsing for another 24 h at a ratio of 1:2 (DC:sarcoma cell). Then, DCs loaded with untreated and irradiated SaOS-2/SYO-1, or sunitinib-treated cells (DCs+SaOS-2/SYO-1+SUN) were mixed with autologous CD3+ T cells at a ratio of 1:10 (DC:T cell) After 5 days, the percentage of PD-1 on (A) CD4+ and CD8+ T cells, (B) naïve (N), central memory (CM), effector memory (EM), and EM expressing RA (EMRA) CD4+ and CD8+T cells and (C) Tregs was evaluated by flow cytometry. The values are represented as mean ± SEM of 5 independent experiments. *p < 0.05; **p < 0.01; ***p < 0.001.

