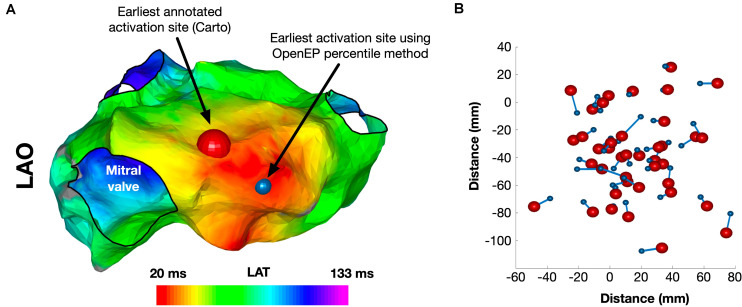
FIGURE 7.
Identification of the site of earliest activation. (A) Example activation map showing the site of earliest activation, defined as the earliest local activation time recorded by Carto shown in red, and the site of earliest activation using the OpenEP percentile method shown in blue. (B) Relationship between Carto earliest activation sites and OpenEP earliest activation sites for all 40 cases. The Carto-defined earliest activation sites are shown with red spheres and the OpenEP-defined earliest activation sites are shown with blue spheres. The connecting lines indicate the pairing of data points on a case-by-case basis. LAO, left anterior oblique; LAT, local activation time.

