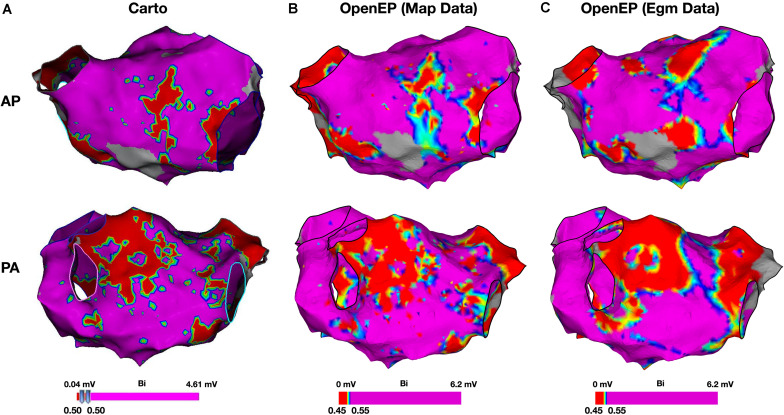
FIGURE 9.
Bipolar voltage mapping. (A) Voltage maps created using Carto, with a voltage threshold of 0.5 mV. (B) Voltage maps created using OpenEP with a voltage threshold range of 0.4–0.6 mV applied to the voltage mapping data exported by Carto. OpenEP command: drawMap(userdata, 'type', 'bip', 'coloraxis', [0.4 0.6], 'orientation', 'pa', 'colorfillthreshold', 10); (C) Voltage maps created using OpenEP with a voltage threshold range of 0.45–0.55 mV, interpolated from the raw electrogram data at every mapping point and with a color fill threshold of 10 mm. OpenEP command: interpBip = generateInterpData(userdata, 'bip-map'); drawMap(userdata, 'data', interpBip, 'type', 'bip', 'coloraxis', [0.4 0.6], 'orientation', 'pa'). AP, antero-posterior; PA, postero-anterior; Bi, bipolar voltage.

